Graphical Abstract
Abstract
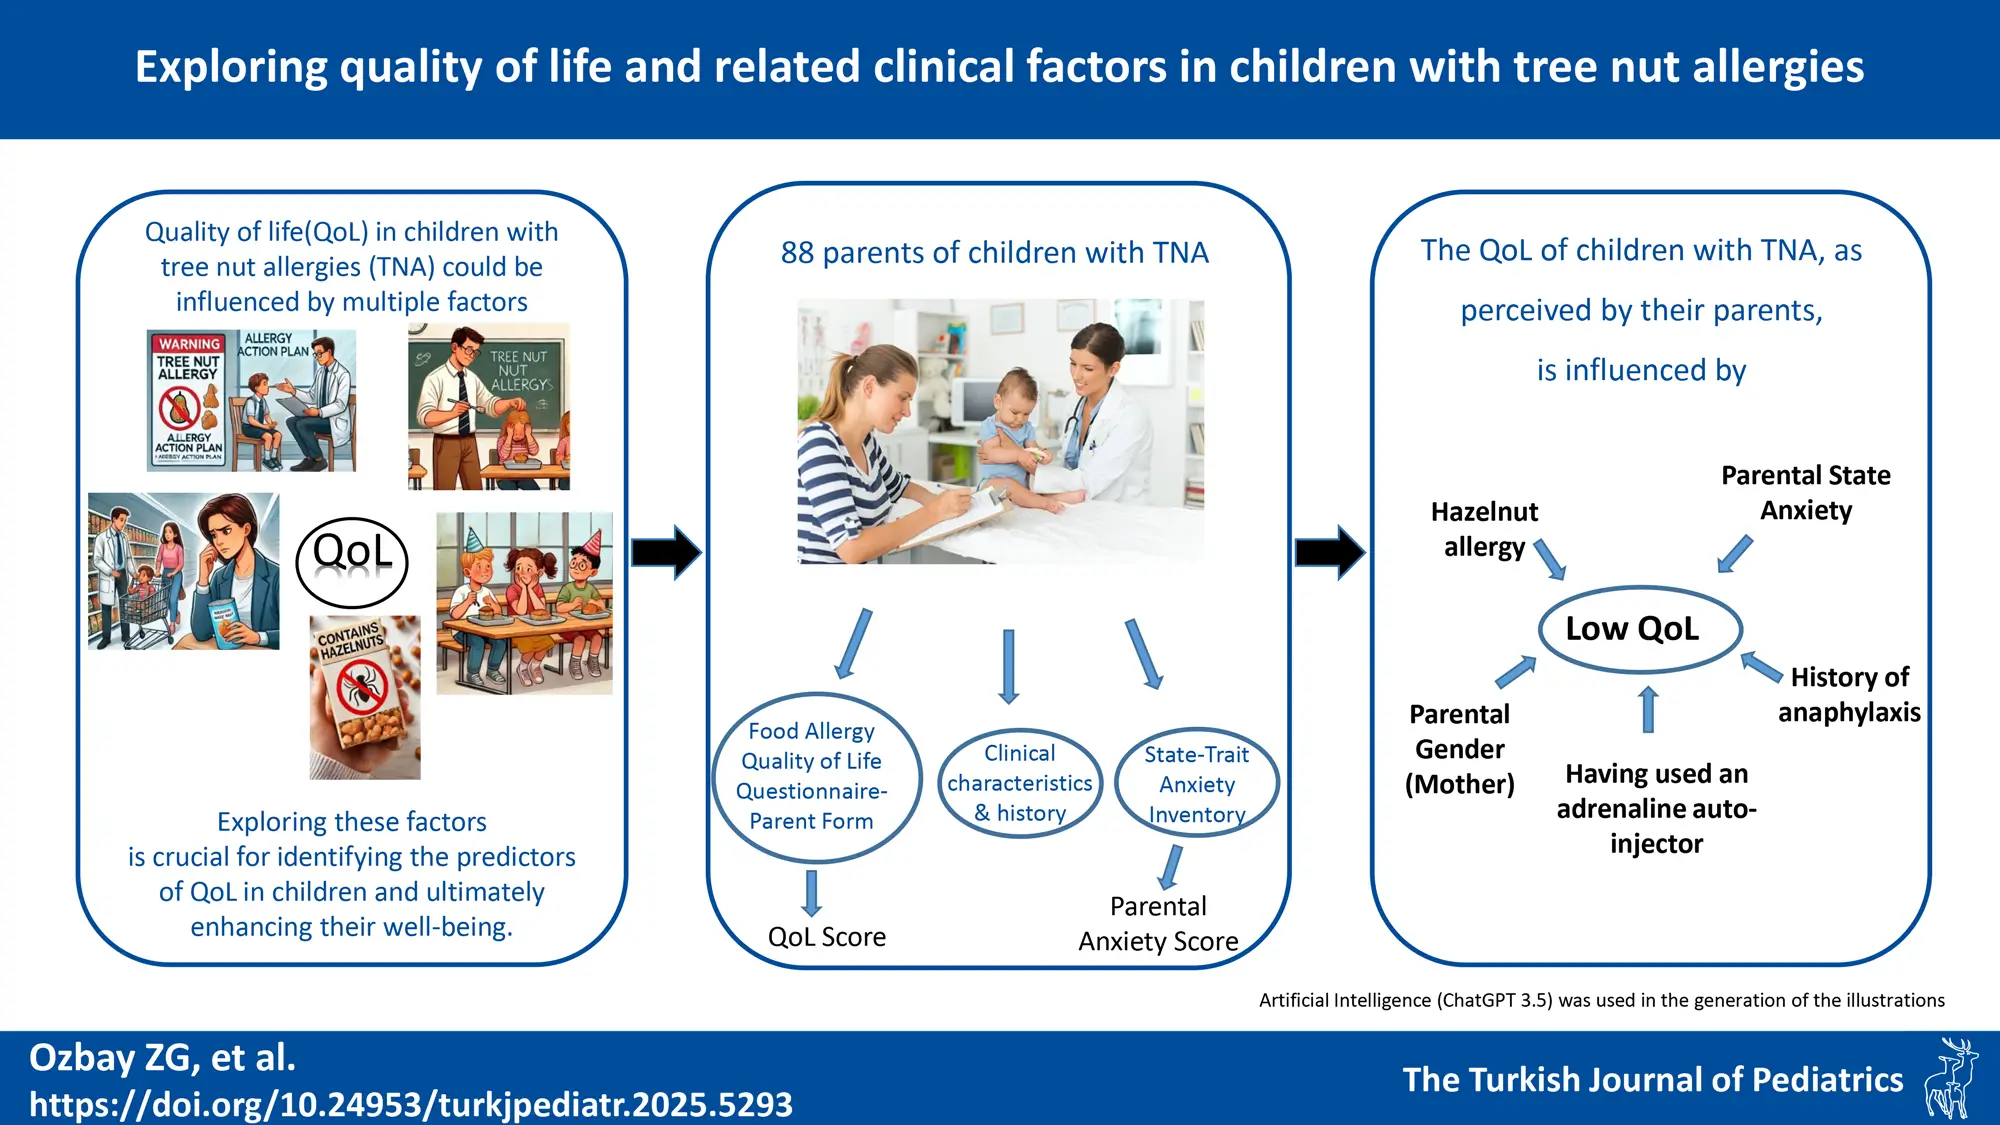
Background. In Türkiye, tree nut allergy (TNA) is the most common form of food allergy, characterized by persistence and the potential for life-threatening reactions. This study aimed to evaluate the quality of life (QoL) of Turkish children aged 0-12 years with IgE-mediated TNA and explore influential factors, including parental anxiety.
Materials and Methods. Primary caregiver-parents of children diagnosed with TNA completed the Food Allergy Quality of Life Questionnaire-Parent Form (FAQLQ-PF) and State-Trait Anxiety Inventory (STAI) to assess QoL and parental anxiety, respectively.
Results. Of 120 eligible patients diagnosed with TNA, 88 were included in the study. Questionnaires were completed by mothers in 79 cases (90%) and fathers in 9 cases (10%). Parents reported significantly higher FAQLQ-PF scores for children with hazelnut allergy, a history of anaphylaxis, and those who had to use an adrenaline auto-injector. There was significant but weak correlations between FAQLQ-PF and anxiety (STAI) domains. The multivariate linear regression analysis revealed that having a hazelnut allergy, a history of anaphylaxis, and higher parental state anxiety were all associated with higher FAQLQ-PF scores, but fathers tended to report better level of QoL.
Conclusion. QoL for children with TNA is influenced by several factors such as adverse life experiences, local and situational factors, and parental anxiety. Understanding these diverse factors is crucial for enhancing the well-being of children with TNA.
Keywords: anxiety, child, nuts, parent, quality of life
Introduction
IgE-mediated food allergy affects up to 6% of children, with varying etiologies across different geographies and cultures.1,2 Peanuts are common allergens in Western countries, while tree nut allergy (TNA) is most prevalent and the leading cause of anaphylaxis among Turkish children.3-5 Strict avoidance of index allergens and immediate access to rescue medications remain the most commonly used management strategies.1 However, oral food immunotherapy and biological agents have recently been introduced to mitigate the severity of reactions to inadvertent exposures.2 Although, with appropriate management, morbidity in children with food allergies is generally low and mortality is rare, food allergies significantly impact the quality of life (QoL) of both children and their families.1 Several factors,including gender, age, disease severity, and concurrent allergies, are associated with lower QoL in children, and these associations vary by population. For instance, a Turkish study linked lower QoL with older age, anaphylaxis, asthma, maternal age over 30, and higher maternal education, while a Greek study found that anaphylactic reactions, epinephrine auto-injector usage, and multiple food allergies decreased QoL.6,7 Understanding these factors is crucial for improving the overall well-being of these children and their families.
Food allergies (FA) can substantially affect the QoL of children, not only through dietary limitations but also by impacting social, emotional, and psychological well-being. Parental anxiety further exacerbates these challenges, disrupting daily routines and fostering avoidance behaviors. Despite this, data on the influence of parental anxiety on QoL in children with TNA are scarce. Therefore, our study aims to evaluate the food allergy-related QoL (FAQL) in children with TNA, as perceived by their parents, and to explore the factors—including parental anxiety—that influence this assessment.
Materials and Methods
Study population
This study was carried out with primary caregivers (mothers/fathers) of patients aged 12 years and younger who were diagnosed with TNA at Hacettepe University Hospital, Department of Pediatric Allergy between January 1, 2018 and December 31, 2020. During outpatient clinic visits, we requested parents to complete online surveys about their children’s TNAs. For those who consented, we subsequently sent a survey link via text message. For the designation of the primary caregiver, parents were given the autonomy to determine who is most responsible for the child’s care and upbringing. In cases of uncertainty, the decision was made based on the understanding that the parent who prioritizes the child’s health—especially in the context of TNAs—should serve as the primary caregiver. All patients were required to have sensitization to the relevant tree nut by skin prick test, extract-specific IgE and allergen molecule specific IgE (Ana o 3/Pis v 1 for cashew/pistachio, Cor a 14/Cor a 9/Cor a 11 for hazelnut, Jug r 1/Jug r 2 for walnut).8 The diagnosis of TNA was required to have been made at least 6 months prior by the presence of a consistent history or positive outcome at the oral food challenge (OFC) or high level of sensitization as described previously.3,9 Parents who could not be contacted, who did not give informed consent, and whose child was older than 12 years of age were not included into the study. This study was performed in line with the principles of the Declaration of Helsinki. Approval was granted by the Hacettepe University Ethics Committee for Non-Interventional Clinical Studies (GO 21/745). All parents gave written informed consent before the study.
Questionnaires
With the questionnaire, information such as sociodemographic characteristics, comorbid diseases, adrenaline auto-injector (AAI) usage, tree nut and other FAs, healthcare utilizations such as unscheduled healthcare use/emergency and hospital admissions due to TNA were collected. The data obtained from the questionnaires were cross-checked with the information in the hospital electronic database and inconsistencies were resolved through interviews. Internationally recognized instruments renowned for their validity and reliability—the Food Allergy Quality of Life Questionnaire-Parent Form (FAQLQ-PF) and the State-Trait Anxiety Inventory (STAI)—were used to assess children’s food allergy-related quality of life from the parents’ perspective and parental anxiety, respectively.10-12
Food Allergy Quality of Life Questionnaires-Parent Form: To summarize briefly, the FAQLQ-PF is designed to gauge the quality of life related to FAs in children from the parental perspective. It has a scale of 30 questions, and its Turkish translation has previously been shown to be valid and reliable.6,10 Each question in the scale is answered with a 6-point Likert type variable (0-none to 6-extreme). The scale has a total of 3 sub-dimensions: emotional impact, food anxiety, social and nutritional restrictions. The total score of the scale ranges from 0 to 6, and a low score indicates a high quality of life.10
State-Trait Anxiety Scale: The State-Trait Anxiety Inventory (STAI) is a recognized tool for measuring situational and long-term anxiety. It has a total of 40 statements in the scale and its Turkish translation and adaptation has previously been shown to be valid and reliable.11 The first twenty items measure the level of anxiety related to the situation (STAI-S), and items 21 to 40 measure the trait anxiety (STAI-T).11,12 Accordingly, obtaining 0-19 points from the scale are not significant levels of anxiety, 20-39 points mean mild, 40-59 points mean moderate, 60-79 points mean severe anxiety, and individuals with a score of 60 and above need professional support.11
Statistical analyses
Descriptive analysis were presented with frequency and percentage for categorical variables, and mean±standard deviation, or median (Q1-Q3) for continuous variables. Conformity of continuous variables to normal distribution was examined by visual (histogram and probability graphs) and analytical methods (Kolmogorov-Smirnov / Shapiro-Wilk tests). Independent group comparisons for categorical variables were made with chi-square (χ2) or Fisher tests. Student’s t-test was used in comparison of two independent groups for continuous variables, and one-way analysis of variance (ANOVA) method was used in comparisons of three or more groups. The relationship between STAI and FAQLQ-PF scores was investigated by correlation analysis including Pearson test in parametric and Spearman test in non-parametric correlation analyses. The independent factors predicting the FAQLQ-PF total score were analysed by multivariate linear regression model using possible factors detected in univariate analyses. Statistical significance, the type-1 error level was determined as 5%. G*Power version 3.1.9.7 statistical software was used to calculate the required sample size and statistical power. SPSS for Windows (version 23.0, IBM SPSS Statistics, Chicago, IL) were used for the remaining statistical evaluations.
Results
Study group characteristics
There were 120 eligible patients diagnosed with TNA during the study period and 88 patients were included in the study, resulting in an inclusion rate of 73.3% . As the primary caregivers, 79 (89.8%) of the questionnaires were completed by mothers and 9 (10.2%) by fathers. From the children, 31 (35.2%) were female and 57 (64.8%) were male. The median age at diagnosis was 12 months (Q1-Q3: 7.25-19.5) and median months of follow-up was 40 months (Q1-Q3: 10.25–65.75). The most common TNA was hazelnut (72.7%), followed by cashew, pistachio, walnut and almond. In the context of their life time, 42 (47.7%) and 5 (5.7%) patients had been admitted to the emergency department, and required hospitalization due to TNA, respectively. A total of 42 (47.7%) patients had been exposed to the food they were allergic to in the last year. A total of 49 (55.7%) and 16 (18.2%) patients had a lifetime and current history of anaphylaxis.
Although all patients were prescribed AAIs, only 84.1% of the patients had AAIs. A total of 13 (14.8%) patients had to use AAI at least once in their lives due to a tree nut allergy (Table I). When comparing clinical features across age groups, both having an AAI (p=0.007) and the occurrence of anaphylaxis (p=0.019) were statistically significant. Post-hoc analysis with Bonferroni correction revealed that the 0–3 age group had significantly lower rates of AAI possession (p=0.004) and a lower incidence of anaphylaxis (p=0.008) compared to the 4–6 age group (Table I).
|
Values are presented as number (%); †: mean±standard deviation; AAI, Adrenaline auto-injector; NS, non-significant; * Post-hoc analysis performed with Bonferroni correction, shows statistically significant difference between 0-3 and 4-6 age group (p = 0.004). ** Post-hoc analysis performed with Bonferroni correction, shows statistically significant difference between 0-3 age and 4-6 age group (p = 0.008). |
|||||
| Table I. Clinical characteristics of patients according to age groups. | |||||
|
|
|
|
|||
|
|
|
|
|||
| Female gender |
|
|
|
|
|
| Age of diagnosis (mo) † |
|
|
|
|
|
| Current TN allergy | |||||
| Hazelnut |
|
|
|
|
|
| Cashew |
|
|
|
|
|
| Pistachio |
|
|
|
|
|
| Walnut |
|
|
|
|
|
| Almond |
|
|
|
|
|
| Multiple TN allergy |
|
|
|
|
|
| Concomitant all. disease |
|
||||
| Allergic rhinitis |
|
|
|
|
|
| Atopic dermatitis |
|
|
|
|
|
| Other food allergy |
|
|
|
|
|
| Asthma |
|
|
|
|
|
| Having an AAI* |
|
|
|
|
|
| Having ever used an AAI |
|
|
|
|
|
| Exposure to TN (last year) |
|
|
|
|
|
| Anaphylaxis due TN | |||||
| Ever** |
|
|
|
|
|
| Current |
|
|
|
|
|
| Ever emergency dept. use |
|
|
|
|
|
| Ever hosp. due to TN allergy |
|
|
|
|
|
Food allergy related quality of life
The mean FAQLQ-PF score of the study group was 3.55±1.34, and there was no statistically significant difference between age groups (0-3 years: 3.15±1.28, 4-6 years: 3.76±1.42, 7-12 years: 3.73±1.19; Table II) and parents’ gender (3.61±1.33 for mothers vs 3.23±1.42 for fathers; p=0.32).
|
AAI, Adrenaline auto-injector; Ed, Emergency department; SD, standard deviation; TN, Tree nut. †ANOVA test; *In the post-hoc pairwise comparisons performed with Bonferroni correction, 0-3 age group vs. the 4-6 age group=0.001, 0-3 age group vs. the 7-12 age group=0.004, 4-6 age group vs. 7-12 age group=1.000. |
||||||||
| Table II. Total and subscale scores of FAQLQ-PF according to study variables. | ||||||||
|
|
|
(mean ± SD) |
|
(mean ± SD) |
|
|
|
|
| Sex |
|
|
|
|
||||
| Male |
|
|
|
|
||||
| Female |
|
|
|
|
||||
| Age groups |
|
|
|
|
||||
| 0-3 yr |
|
|
|
|
||||
| 4-6 yr |
|
|
|
|
||||
| 7-12 yr |
|
|
|
|
||||
| TN allergy |
|
|
|
|
||||
| Multiple |
|
|
|
|
||||
| Single |
|
|
|
|
||||
| TN allergy | ||||||||
| Hazelnut (+ / -) |
|
|
|
|
|
|
|
|
| Cashew (+ / -) |
|
|
|
|
|
|
|
|
| Pistachio (+ / -) |
|
|
|
|
|
|
|
|
| Walnut (+ / -) |
|
|
|
|
|
|
|
|
| Almond (+ / -) |
|
|
|
|
|
|
|
|
| Ever anaphylaxis |
|
|
|
|
||||
| Yes |
|
|
|
|
||||
| No |
|
|
|
|
||||
| Having AAI |
|
|
|
|
||||
| Yes |
|
|
|
|
||||
| No |
|
|
|
|
||||
| Use AAI |
|
|
|
|
||||
| Yes |
|
|
|
|
||||
| No |
|
|
|
|
||||
| ED admition |
|
|
|
|
||||
| Yes |
|
|
|
|
||||
| No |
|
|
|
|
||||
| Hospit. due TN |
|
|
|
|
||||
| Yes |
|
|
|
|
||||
| No |
|
|
|
|
||||
| Asthma |
|
|
|
|
||||
| Yes |
|
|
|
|
||||
| No |
|
|
|
|
||||
| Allergic rhinitis |
|
|
|
|
||||
| Yes |
|
|
|
|
||||
| No |
|
|
|
|
||||
| Atopic dermatitis |
|
|
|
|
||||
| Yes |
|
|
|
|
||||
| No |
|
|
|
|
||||
| Sibling allergy |
|
|
|
|
||||
| Yes |
|
|
|
|
||||
| No |
|
|
|
|
||||
| Mother’s educ. |
|
|
|
|
||||
| <University |
|
|
|
|
||||
| ≥University |
|
|
|
|
||||
The scores for children with a hazelnut allergy (p= 0.049), with a previous history of tree nut-induced anaphylaxis (p=0.008), with a history of allergic rhinitis (p=0.008), and those who had to use an AAI (p=0.005) were significantly higher than those without these conditions (Table II).
State-trait anxiety inventory
The STAI scores, categorized by the child’s age groups, are presented in the Table III. Specifically, 55.6% reported mild, 38.6% moderate, and 5.6% severe state anxiety. In addition, 38.6% reported mild, 57.9% moderate, and 3.4% reported severe trait anxiety. The mean STAI-S and STAI-T scores in fathers (36.40±11.54 and 40.07±8.43, respectively) were numerically lower than those in mothers (38.66±13.37 and 43.15±10.31, respectively), but the differences were not statistically significant (p=0.545 and p=0.281 for STAI-S and STAI-T, respectively).
| *ANOVA test; AAI, Adrenaline autoinjector; ED, Emergency department ; STAI, State-Trait anxiety inventory; TN, Tree nut. | ||||
| Table III. STAI-S and STAI-T scores according to study variables. | ||||
|
|
|
|
|
|
| Sex |
|
|
||
| Male |
|
|
||
| Female |
|
|
||
| Prim.Caregivers |
|
|
||
| Mother |
|
|
||
| Father |
|
|
||
| Age groups |
|
|
||
| 0-3 yr |
|
|
||
| 4-6 yr |
|
|
||
| 7-12 yr |
|
|
||
| TN allergy |
|
|
||
| Multiple |
|
|
||
| Single |
|
|
||
| TN allergy | ||||
| Hazelnut (+/-) |
|
|
|
|
| Cashew (+/-) |
|
|
|
|
| Pistachio (+/-) |
|
|
|
|
| Walnut (+/-) |
|
|
|
|
| Almond (+/-) |
|
|
|
|
| Ever anaphylaxis |
|
|
||
| Yes |
|
|
||
| No |
|
|
||
| Having AAI |
|
|
||
| Yes |
|
|
||
| No |
|
|
||
| Use AAI |
|
|
||
| Yes |
|
|
||
| No |
|
|
||
| ED admition |
|
|
||
| Yes |
|
|
||
| No |
|
|
||
| Hospitalization |
|
|
||
| Yes |
|
|
||
| No |
|
|
||
| Asthma |
|
|
||
| Yes |
|
|
||
| No |
|
|
||
| Allergic rhinitis |
|
|
||
| Yes |
|
|
||
| No |
|
|
||
| Atopic dermatitis |
|
|
||
| Yes |
|
|
||
| No |
|
|
||
| Sibling allergy |
|
|
||
| Yes |
|
|
||
| No |
|
|
||
| Mother’s educ. |
|
|
||
| <University |
|
|
||
| ≥University |
|
|
||
When the relationships between anxiety scores and baseline demographic and clinical characteristics of the patients were investigated using bivariate tables, there were higher STAI-S scores for the parents who needed to use AAI (p<0.001) and higher STAI-T scores in parents whose child was hospitalized due to TNA (p=0.031, Table III). There was also a strong positive correlation between STAI-S and STAI-T scores (r=0.584; p<0.001).
The relationship between food allergy related quality of life and parental anxiety
When we analyzed the association between STAI scores and the total/subscales of FAQLQ-PF scores using correlations, we found overall significant but weak positive correlations between parental anxiety and QoL, as well as its subscales (Table IV). These findings suggest that a higher level of anxiety in parents is weakly associated with a decrease in the child’s QoL from the parents’ perspective. Furthermore, when the association between STAI and total FAQLQ scores was analysed using univariate linear regression analyses, the increase in STAI-S (B=0.032; 95% confidence interval [CI]: 0.011- 0.053; p=0.003) and STAI-T scores (B=0.037; 95% CI: 0.001 - 0.065; p=0.009) was associated with an increase in total FAQLQ-PF scores (a decrease in QoL). When we look at the correlation between parental anxiety levels and FAQLQ-PF scores, there was a weak positive correlation between mother’s STAI-S and FAQLQ-PF scores (r=0.306; p=0.009). Similarly, it turned out to be a weak positive correlation between mother’s STAI-T and FAQLQ-PF scores (r=0.241; p=0.040). On the other hand, there was no statistically significant correlation either between father’s STAI-S and FAQLQ-PF scores (r=0.310; p=0.261) or STAI-T and FAQLQ-PF scores (r=0.447; p=0.095).
| FAQLQ, Food Allergy Quality of Life Questionnaire; r, Pearson correlation coefficient; STAI, State-Trait Anxiety Inventory | ||||||||
| Table IV. Results of correlations between STAI-State/Trait scores and FAQLQ-PF total/subdimension scores. | ||||||||
|
|
|
|
|
|||||
|
|
|
|
|
|
|
|
|
|
| STAI-State |
|
|
|
|
|
|
|
|
| STAI-Trait |
|
|
|
|
|
|
|
|
Multivariate linear regression analysis was performed to model the relationship between FAQLQ-PF (dependent variable) and independent variables by assuming a linear relationship between the variables. In the model where STAI-S was included, fathers as primary caregiver (B= -1.035; 95% CI: -1.761 / -0.310; p=0.006), having hazelnut allergy (B =0.717; 95% CI: 0.058 / 1.376; p=0.033), having a history of anaphylaxis (B=0.707; 95% CI: 0.171 / 1.244; p=0.010), and STAI-S scores (B=0.024; 95% CI: 0.004 / 0.044; p=0.019) were significant predictors (Table V). When analysis was repeated by including STAI-T but not STAI-S, similar predictors were depicted except borderline non-significance achieved for STAI-T (Table V). Our findings indicate that considering fathers’ viewpoints may yield more favorable assessments of children’s QoL. Parents of children with hazelnut allergies and with a history of anaphylaxis tend to report lower QoL for their children. Notably, higher parental state anxiety, as opposed to trait anxiety, is significantly linked to a lower perceived QoL in the child.
| CI, Confidental interval; FAQLQ, Food Allergy Quality of Life Questionnaires; STAI, State-Trait Anxiety Inventory; TN, Tree nut. | ||||||
| Table V. Results of multivariate linear regression analysis including FAQLQ total score and STAI scores. | ||||||
| Independent variables |
|
|
||||
|
|
|
|
|
|
|
|
| Primary caregiver (Father/mother) |
|
|
|
|
|
|
| Age groups |
|
|
|
|
|
|
| Current TN allergy | ||||||
| Hazelnut (+/-) |
|
|
|
|
|
|
| Cashew (+/-) |
|
|
|
|
|
|
| Pistachio (+/-) |
|
|
|
|
|
|
| Walnut (+/-) |
|
|
|
|
|
|
| Almond (+/-) |
|
|
|
|
|
|
| Anaphylaxis (+/-) |
|
|
|
|
|
|
| STAI scores |
|
|
|
|
|
|
Discussion
This study, one of the few to assess QoL in children with TNA13,14, differs from previous research by incorporating parental anxiety in two domains—state and trait anxiety. While our findings align with earlier studies demonstrating the detrimental impact of negative experiences on QoL13, they also provide novel insights. First, our data underscore the potential impact of parental state anxiety on reported QoL. Second, the findings suggest that local factors, such as specific nut allergies, may further influence QoL. Additionally, our study indicates that assessing QoL from the father’s perspective may yield distinct results, though this issue requires further clarification.
Limited data exist regarding food allergy-related quality of life in children under 12 years old. When comparing our group’s total scores with previous studies using the same scale, our FAQLQ-PF scores fall on the lower (negative) side (0–3 years: 3.15±1.28; 4–6 years: 3.76±1.42; 7–12 years: 3.73±1.19).15,16 These results are consistent with the Turkish validation study of the FAQLQ-PF and a recent study from another region in Türkiye6,17, yet they align with findings from studies conducted in Ireland, the United States, and Thailand, suggesting consistency across diverse populations.10,18-20 This discrepancy may be attributed to the persistent and severe nature of tree nut allergies and the particular characteristics of our study group.
Our age subgroup analysis revealed that the 0–3 age group had significantly lower rates of adrenaline auto-injector possession (p=0.004) and a lower incidence of anaphylaxis (p=0.008) compared to the 4–6 age group. These findings were anticipated, as adrenaline auto-injectors (0.1 mg) are not available for children under 1 year in Türkiye, and younger children are under strict maternal supervision, reducing the need for auto-injector prescriptions. Notably, most anaphylaxis events in this age group occurred during the first exposure, indicating the onset of an allergy.
Bivariate comparisons demonstrated that FAQLQ-PF scores were lower in children who experienced anaphylaxis and in those who used adrenaline auto-injectors compared to those who did not. This effect was evident across all three components—emotional impact, food anxiety, and social limitations—in children who used adrenaline auto-injectors, whereas in children who experienced anaphylaxis, significant differences were observed only in the emotional impact and food anxiety. We have previously shown that parents are often hesitant to use adrenaline auto-injectors21; thus, the observed differences likely reflect not only the experience of anaphylaxis but also the decision-making process regarding auto-injector use. Furthermore, patients with allergic rhinitis exhibited lower FAQLQ-PF scores than those without, which we attribute to their older age and cumulative negative experiences.
Research on parental anxiety in the context of children’s food allergies has yielded mixed results.1,22-26 Some studies report that mothers of food-allergic children experience higher stress and anxiety levels compared to mothers of non-allergic children, while others find no significant differences in anxiety or depression levels between these groups.27,28 Given that parents play a crucial role in shaping their children’s emotional development—through mechanisms such as emotional contagion—understanding parental anxiety is essential.
To our knowledge, only two previous studies have examined the connection between food allergy-related quality of life in children and parental anxiety.29,30 DunnGalvin et al.’s29 study, using the GAD-7 questionnaire, reported a significant link between parental general anxiety and FAQLQ in Russian children and adolescents, while Acaster et al.’s30 study, using the Hospital Anxiety and Depression Scale (HADS), found that parental anxiety significantly predicted a higher burden for peanut-allergic children. Although our study reaffirms the association between parental anxiety and QoL, our findings offer a nuanced perspective by focusing specifically on state anxiety. While state and trait anxiety scores were correlated in our study, the greater predictive capacity of state anxiety provides a deeper understanding of how to enhance the accuracy of QoL assessments in the context of food allergies. Different assessment tools (e.g., STAI, GAD-7, and HADS) measure various dimensions of anxiety; thus, observed disparities may stem from these inherent differences.
We would like to emphasize that it could be argued that using trait anxiety scores in this study provides greater clinical relevance than state anxiety. Nonetheless, in our study, trait and state anxiety scores were correlated, with significant overlap observed in the results of the multivariate analyses. We speculate that the state anxiety experienced by parents may be influenced by the recall of past TNA-related experiences during the completion of the questionnaire.
We also observed that assessing QoL from the father’s perspective may yield better insights at multivariate analysis. Whether parental anxiety differs between mothers and fathers is complex, with studies yielding mixed results.28,31 Some evidence suggests that mothers experience greater anxiety, particularly regarding their children’s health and safety, while fathers may exhibit concerns about other aspects of their children’s well-being.32 Given the low number and limited representation of fathers in our study, we recognize the need for gender-specific studies among parents to validate these findings.
Our study also demonstrated that the presence of a hazelnut allergy negatively impacts FAQLQ, implying that local factors contribute to QoL. In Türkiye, where hazelnuts are a major agricultural product and a staple in the diet, hazelnut allergy is a primary cause of IgE-mediated food allergies and anaphylaxis, heightening parental concerns about accidental exposure.3-5,33
Limitations include the lack of a prospective design to document the evolving effect of state anxiety on FAQLQ-PF scores over time and a modest sample size, which may increase the potential for type II errors. Specifically, the limited number of fathers in the study restricts the generalizability of our conclusions to that group. Additionally, participants with lower socioeconomic or cultural backgrounds or those inattentive while completing the questionnaire may have influenced the results—a common issue in questionnaire-based studies. Moreover, it can be placed among limitations that we couldn’t include parents who could not be contacted or who did not give informed consent to this study. Nevertheless, to our knowledge this study is the only one exclusively dedicated to TNA in the pediatric population in the Eastern Mediterranean region and represents the first effort to explore various domains of anxiety within this context.
In conclusion, the QoL of children with TNA, as perceived by their parents, is influenced by universal factors such as adverse life experiences, local factors like culinary culture, situational factors such as state anxiety, and potentially parent-specific factors such as gender. Understanding these multifaceted influences is crucial for identifying the predictors of food allergy related quality of life in children and ultimately enhancing their well-being.
Ethical approval
The study protocol was reviewed and approved by the Institutional Review Board of Hacettepe University (date: 15.06.2021, number: 21/745) and those who gave informed consent for the study completed the questionnaire.
Source of funding
The authors declare the study received no funding.
Conflict of interest
The authors declare that there is no conflict of interest.
References
- Cummings AJ, Knibb RC, King RM, Lucas JS. The psychosocial impact of food allergy and food hypersensitivity in children, adolescents and their families: a review. Allergy 2010; 65: 933-945. https://doi.org/10.1111/j.1398-9995.2010.02342.x
- Sampath V, Abrams EM, Adlou B, et al. Food allergy across the globe. J Allergy Clin Immunol 2021; 148: 1347-1364. https://doi.org/10.1016/j.jaci.2021.10.018
- Akarsu A, Ocak M, Köken G, Şahiner ÜM, Soyer Ö, Şekerel BE. IgE mediated food allergy in Turkey: different spectrum, similar outcome. Turk J Pediatr 2021; 63: 554-563. https://doi.org/10.24953/turkjped.2021.04.002
- Mir MM, Rehman MU, Iqbal U, Mir SA, editors. Temperate nuts. Springer; 2019.
- Kahveci M, Akarsu A, Koken G, Sahiner UM, Soyer O, Sekerel BE. Food-induced anaphylaxis in infants, as compared to toddlers and preschool children in Turkey. Pediatr Allergy Immunol 2020; 31: 954-961. https://doi.org/10.1111/pai.13320
- Arik Yilmaz E, Cavkaytar O, Buyuktiryaki B, et al. Factors affecting food allergy-related quality of life from parents’ perception in Turkish children. Allergy Asthma Immunol Res 2018; 10: 379-386. https://doi.org/10.4168/aair.2018.10.4.379
- Vassilopoulou E, Comotti A, Athanasaki D, Milani GP, Agostoni C, Konstantinou GN. Translation and validation of the Greek Food Allergy Quality of Life Questionnaire-Parental Form. Pediatr Rep 2024; 16: 1054-1063. https://doi.org/10.3390/pediatric16040090
- Akarsu A, Ocak M, Sahiner UM, Soyer O, Sekerel BE. Multiplex component-based allergen macroarray test is useful to predict clinical reactivity to tree nuts in children. Allergol Int 2022; 71: 236-247. https://doi.org/10.1016/j.alit.2021.10.001
- Cetinkaya PG, Buyuktiryaki B, Soyer O, Sahiner UM, Sackesen C, Sekerel BE. Phenotypical characterization of tree nuts and peanut allergies in east Mediterranean children. Allergol Immunopathol (Madr) 2020; 48: 316-322. https://doi.org/10.1016/j.aller.2019.07.005
- DunnGalvin A, de BlokFlokstra BM, Burks AW, Dubois AE, Hourihane JO. Food allergy QoL questionnaire for children aged 0-12 years: content, construct, and cross-cultural validity. Clin Exp Allergy 2008; 38: 977-986. https://doi.org/10.1111/j.1365-2222.2008.02978.x
- Şahin A. State Test Anxiety Scale (STAS): validity and reliability study. Trakya Journal of Education 2019; 9: 78-90. https://doi.org/10.24315/tred.450423
- Şahin A. Validation of a new State Test Anxiety Scale (STAS). International Journal of Assessment Tools in Education 2021; 8: 872-887. https://doi.org/10.21449/ijate.838622
- Pasioti M, Savva M, Lakoumentas J, et al. Impact of presumed tree nut and peanut allergy on quality of life at different ages. J Clin Med 2023; 12: 3472. https://doi.org/10.3390/jcm12103472
- Cummings AJ, Knibb RC, Erlewyn-Lajeunesse M, King RM, Roberts G, Lucas JSA. Management of nut allergy influences quality of life and anxiety in children and their mothers. Pediatr Allergy Immunol 2010; 21: 586-594. https://doi.org/10.1111/j.1399-3038.2009.00975.x
- Wassenberg J, Cochard MM, Dunngalvin A, et al. Parent perceived quality of life is age-dependent in children with food allergy. Pediatr Allergy Immunol 2012; 23: 412-419. https://doi.org/10.1111/j.1399-3038.2012.01310.x
- McCann WA, Nowak-Wegrzyn A, Hass SL, Huang D, Donelson SM. Peanut allergy burden survey: factors associated with health-related quality of life in adolescents. Clin Transl Allergy 2023; 13: e12234. https://doi.org/10.1002/clt2.12234
- Kılıç N, Kaya Ş, Taşçı G, Özsoy F, Kılıç M. Quality of life in children with food allergies, psychiatric symptoms, and caregiving burden of their mothers. Allergol Immunopathol (Madr) 2023; 51: 48-56. https://doi.org/10.15586/aei.v51i5.860
- DunnGalvin A, Cullinane C, Daly DA, Flokstra-de Blok BM, Dubois AE, Hourihane JO. Longitudinal validity and responsiveness of the Food Allergy Quality of Life Questionnaire - Parent Form in children 0-12 years following positive and negative food challenges. Clin Exp Allergy 2010; 40: 476-485. https://doi.org/10.1111/j.1365-2222.2010.03454.x
- Limpitikul W, Srisuwatchari W, Jirapongsananuruk O, Visitsunthorn N, Pacharn P. Validation and reliability of the Thai version of the Food Allergy Quality of Life Questionnaire-Parent Form (FAQLQ-PF). Asian Pac J Allergy Immunol 2023; 41: 236-243. https://doi.org/10.12932/AP-030220-0755
- DunnGalvin A, Koman E, Raver E, et al. An examination of the Food Allergy Quality of Life Questionnaire performance in a countrywide American sample of children: cross-cultural differences in age and impact in the United States and Europe. J Allergy Clin Immunol Pract 2017; 5: 363-368.e2. https://doi.org/10.1016/j.jaip.2016.09.049
- Esenboga S, Ocak M, Cetinkaya PG, et al. Physicians prescribe adrenaline autoinjectors, do parents use them when needed? Allergol Immunopathol (Madr) 2020; 48: 3-7. https://doi.org/10.1016/j.aller.2019.07.009
- Polloni L, Muraro A. Anxiety and food allergy: a review of the last two decades. Clin Exp Allergy 2020; 50: 420-441. https://doi.org/10.1111/cea.13548
- King RM, Knibb RC, Hourihane JO. Impact of peanut allergy on quality of life, stress and anxiety in the family. Allergy 2009; 64: 461-468. https://doi.org/10.1111/j.1398-9995.2008.01843.x
- Knibb RC, Semper HM. Anxiety and depression in parents with food allergic children before and after food allergy diagnosis. Psychol Health 2008; 23(Suppl 1): 161.
- Lau GY, Patel N, Umasunthar T, et al. Anxiety and stress in mothers of food-allergic children. Pediatr Allergy Immunol 2014; 25: 236-242. https://doi.org/10.1111/pai.12233
- Beken B, Celik V, Gokmirza Ozdemir P, Sut N, Gorker I, Yazicioglu M. Maternal anxiety and internet-based food elimination in suspected food allergy. Pediatr Allergy Immunol 2019; 30: 752-759. https://doi.org/10.1111/pai.13100
- Goodwin RD, Rodgin S, Goldman R, et al. Food allergy and anxiety and depression among ethnic minority children and their caregivers. J Pediatr 2017; 187: 258-264.e1. https://doi.org/10.1016/j.jpeds.2017.04.055
- Möller EL, Nikolić M, Majdandžić M, Bögels SM. Associations between maternal and paternal parenting behaviors, anxiety and its precursors in early childhood: a meta-analysis. Clin Psychol Rev 2016; 45: 17-33. https://doi.org/10.1016/j.cpr.2016.03.002
- DunnGalvin A, Treneva M, Pampura A, Grebenko A, Makatsori M, Munblit D. Quality of life associated with maternal anxiety disorder in Russian children and adolescents with food allergy. Pediatr Allergy Immunol 2020; 31: 78-84. https://doi.org/10.1111/pai.13130
- Acaster S, Gallop K, de Vries J, et al. Psychosocial and productivity impact of caring for a child with peanut allergy. Allergy Asthma Clin Immunol 2020; 16: 83. https://doi.org/10.1186/s13223-020-00477-3
- Teetsel RN, Ginsburg GS, Drake KL. Anxiety-promoting parenting behaviors: a comparison of anxious mothers and fathers. Child Psychiatry Hum Dev 2014; 45: 133-142. https://doi.org/10.1007/s10578-013-0384-8
- Cowan PA, Cowan CP, Pruett MK, Pruett K. Fathers’ and mothers’ attachment styles, couple conflict, parenting quality, and children’s behavior problems: an intervention test of mediation. Attach Hum Dev 2019; 21: 532-550. https://doi.org/10.1080/14616734.2019.1582600
- Kahveci M, Koken G, Şahiner ÜM, Soyer Ö, Şekerel BE. Immunoglobulin e-mediated food allergies differ in East Mediterranean children aged 0-2 years. Int Arch Allergy Immunol 2020; 181: 365-374. https://doi.org/10.1159/000505996
Copyright and license
Copyright © 2025 The Author(s). This is an open access article distributed under the Creative Commons Attribution License (CC BY), which permits unrestricted use, distribution, and reproduction in any medium or format, provided the original work is properly cited.