Graphical Abstract
Abstract
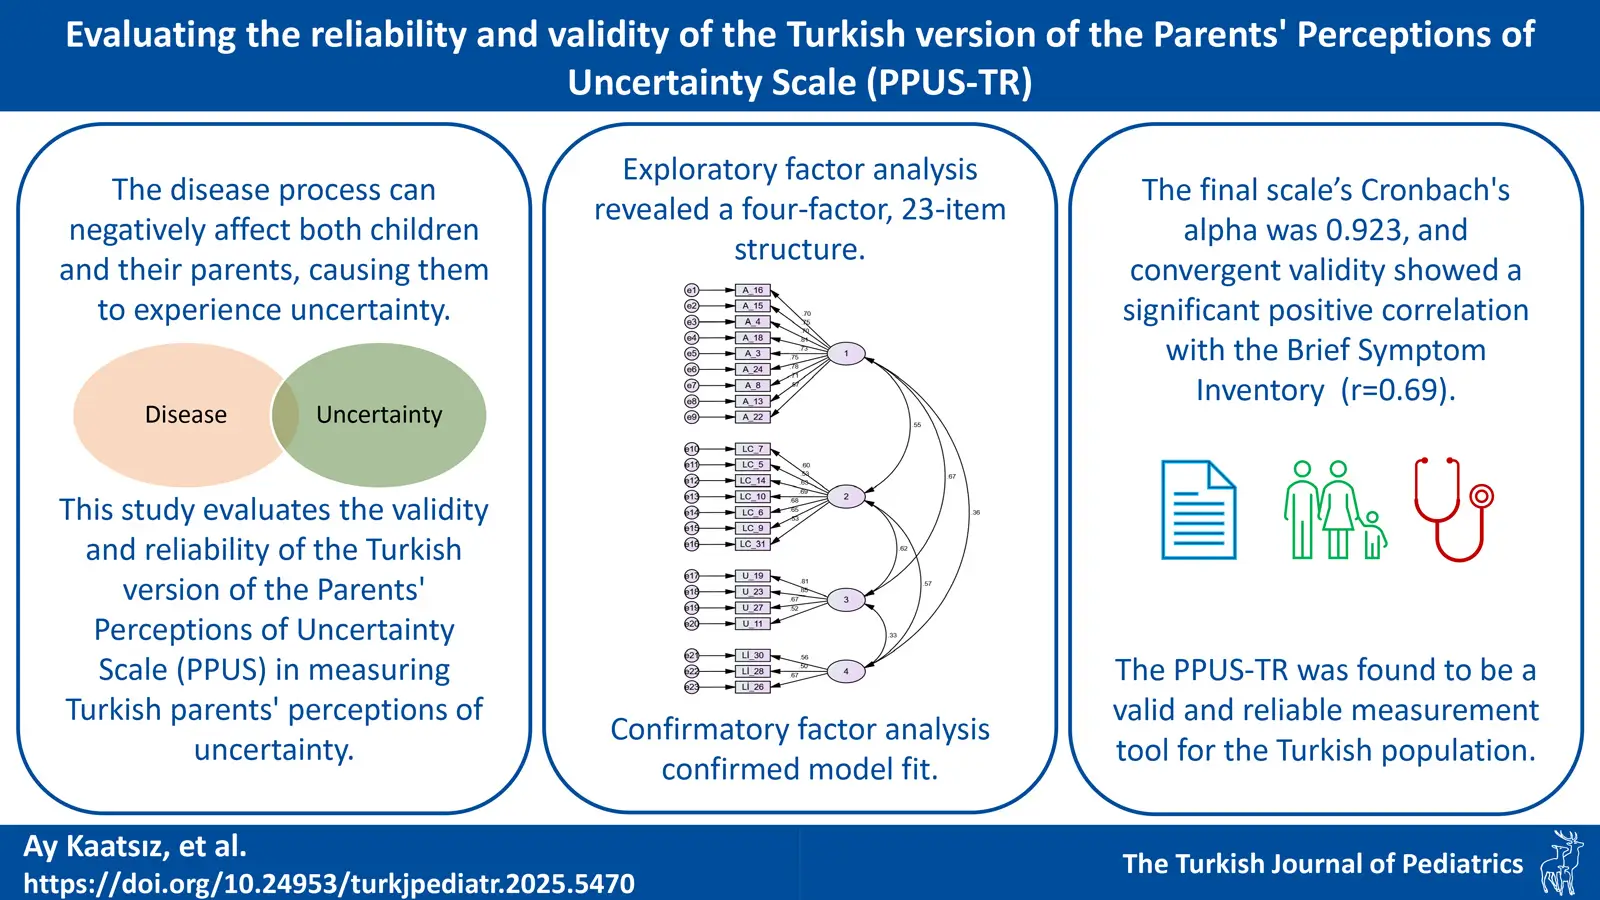
Background: The disease process can negatively affect both children and their parents, causing them to experience uncertainty. This study aims to determine whether the Turkish version of the Parents’ Perceptions of Uncertainty Scale (PPUS) is a valid and reliable instrument for measuring Turkish parents’ perceptions of uncertainty.
Methods: Data were collected from 351 parents. Data collection tools included the Descriptive Data Form, PPUS, and the Brief Symptom Inventory (BSI). Language, face, and content validity, descriptive statistics, internal consistency analyses, explanatory and confirmatory factor analyses, and convergent validity analyses were conducted.
Results: The content validity index (CVI) was calculated as 0.96. As a result of the exploratory factor analysis, a four-factor structure with 23 items explaining 57.98% of the total variance was obtained. Confirmatory factor analysis supported the model fit. The Cronbach’s alpha coefficient for the final version of the scale was 0.923. Convergent validity showed a significant positive relationship with the BSI (r=0.69).
Conclusions: The Turkish version of PPUS (PPUS-TR) was found to be a valid and reliable measurement tool.
Keywords: nursing, parents, pediatrics, uncertainty
Introduction
The concept of uncertainty has been defined in healthcare as the inability to determine the meaning of disease-related events, which occurs when the decision-maker cannot assign a precise value to objects or events or predict outcomes accurately.1 Uncertainty in illness can arise from limited information, unpredictable symptoms, unclear disease progression, inadequate social and healthcare support, and difficulties in understanding or making sense of disease-related developments.2 Therefore, especially in chronic diseases, the disease is often accompanied by uncertainty, significantly affecting patients’ adaptation to the process, quality of life, and disease prognosis.1,3 So much so that adapting to life during the disease and overcoming its uncertainty is sometimes shown as a more significant source of stress than the disease itself.4
The experience of uncertainty negatively affects both child and adult patients, significantly raising anxiety levels and reducing tolerance even in healthy children and adolescents.5 The uncertainty created by the phenomenon of chronic disease due to its variable nature and unpredictable process also causes similar problems in children and adolescents. In two different studies conducted with children with autism6 and children with attention deficit-hyperactivity disorder7, it was found that there is a positive relationship between uncertainty and anxiety and that uncertainty intolerance increased the incidence of anxiety disorders. Disease uncertainty has also been associated with a lower quality of life in children diagnosed with cancer.8 Uncertainty related to chronic illnesses in children and adolescents negatively affects their psychosocial well-being throughout the diagnosis, care, and rehabilitation processes. Similarly, the uncertainty experienced by primary caregivers, particularly parents, also has an adverse impact.
The perception of uncertainty experienced by the parents of pediatric patients was defined by Merle H. Mishel.9 Mishel states that uncertainty, as a perceptual variable, prevents a precise evaluation of events and limits coping; the ability to resolve uncertainty also affects how well a person can cope with any situation.1,10 Considering the profound impact of parents’ emotional state on their children, particularly during illness, Mishel assumed that parents’ ability to navigate the uncertainties of illness could significantly boost their children’s confidence and peace of mind.10 It is stated that parents’ perception of uncertainty regarding their child’s illness increases the level of uncertainty and stress experienced by the sick child.11 Even if the treatment outcome is positive, the perception of uncertainty causes families to have difficulty adapting to the process and coping with the current situation.12 Research has indicated that the perception of uncertainty not only adversely affects parents’ mental health but also leads to an increase in their children’s levels of uncertainty, resulting in psychological issues.13-16 In this context, identifying uncertainty in parents of children and adolescents with chronic diseases with valid and reliable methods is essential in terms of protecting the mental health of children and adolescents and their parents, managing the disease process more effectively, and facilitating adaptation to the process.
The Parent Perception of Uncertainty Scale (PPUS)10 has been widely used for parents’ perceptions of uncertainty. The scale has been translated into many languages, such as Arabic, Chinese, and Spanish17-20, and the versions in these cultures have been found to have high validity and reliability. It has also been determined that the scale has been used in studies conducted with parents of children with many different diagnoses.21-24 On the other hand, to date there have been no tool that measures the perceptions of uncertainty of parents of children with chronic diseases in Türkiye although the perceptions of uncertainty experienced by this population have been mentioned in some qualitative studies.25,26 Within the scope of the literature review, a congress abstract was found stating that the psychometric properties of the Turkish version of the PPUS (PPUS-TR) were performed.27 Still, since the full text of the study was not available, the details of the analyses could not be accessed. Furthermore, no study using this version in Türkiye has been obtained.
The effectiveness of intervention studies relies on identifying specific needs within target populations using valid, reliable, measurable, and repeatable tools. In this context, a valid and reliable measurement is essential for interventions designed to support Turkish parents facing uncertainty about their children’s chronic illnesses. Additionally, given the evolution of healthcare systems and cultural shifts since the PPUS was developed, it is necessary to confirm its applicability for assessing parental uncertainty across different cultures in a changing world. Therefore, this study addresses these gaps by evaluating the PPUS’s validity and reliability in measuring Turkish parents’ perceptions of uncertainty. The aims of our study were to determine the validity and reliability of PPUS-TR and the relationship between PPUS-TR and the Brief Symptom Inventory (BSI) in parents of children with chronic diseases in Türkiye.
Materials and Methods
Study methodology
This study’s methodological design was to test the psychometric properties of the Turkish version of the PPUS for parents of children between the ages of 0-18 years with chronic diseases.
Participants
The research population included parents of newborns, children, and adolescents with chronic diseases between the ages of 0-18 years who were receiving inpatient and/or outpatient treatment in Ankara. The research was conducted in the clinics of one university and two state hospitals to ensure a diverse and representative sample. The following clinics were visited in the institutions where approval was obtained to conduct the study: pediatric emergency, pediatric surgery, pediatric intensive care, neonatal intensive care, general pediatrics, hematology, endocrinology, cardiology, cardiovascular surgery, neurology, orthopedics and traumatology, plastic and reconstructive surgery, urology, adolescent ward, and infant ward. Convenience sampling method was chosen to select the sample from the population. The criteria for parents to be included in the study were as follows: 1) having at least one child between the ages of 0-18 years with a chronic disease (such as diabetes, epilepsy, asthma, or cancer), 2) confirming that the child does not have any mental or physical condition that would prevent participation in the study, 3) being able to read and understand Turkish. Parents who did not meet these criteria were excluded from the study.
In scale adaptation studies, the recommendation is to reach at least 8-10 times the number of items28; some sources even suggest reaching 200-500 people during the translation and adaptation processes, regardless of the number of items on the scale.29,30 To align with literature recommendations and achieve ten times the scale items, the target sample size was set at a minimum of 350 participants.
Procedures
The research was conducted per international guidelines on the cross-cultural adaptation of self-report scales.30,31 First, due to Mishel’s death, who had the right to authorize all versions of the scale, the necessary permission was obtained by contacting the institution where Mishel worked when she developed the scale. The scale was translated by two native Turkish speakers proficient in English: one with no clinical background, and the other with an academic specializing in psychiatry/psychology. Both translators received a report addressing complex or ambiguous expressions and word choice justifications. Their translations were synthesized, discrepancies discussed, and merged into a single version. This version was then back-translated by two other translators. All versions were reviewed by 10 psychiatry/psychology experts. A field expert finalized the pre-test version of the scale. After obtaining the necessary permissions from the institutions, the final version of the scale was piloted with 20 parents who met the inclusion criteria. The second researcher regularly visited the institutions from October 2022 to February 2024 until the target number of participants was reached. After explaining the research’s purpose and scope, forms were administered face-to-face to parents who verbally and in writing confirmed their willingness to participate. Filling out the scales took approximately 15 minutes. Participants provided feedback on the clarity of scale items and their appearance, but this data was excluded to ensure study rigor. Once face and language validity were confirmed, the scale was administered to 351 parents, completing the research process.
Outcome measures
Descriptive data form: This 13-question form, developed by the researchers based on a literature review17,32, includes information on participants’ age, gender, marital status, education level, income status, knowledge of the diagnosis, and opinion about the severity of the diagnosis, as well as the child’s age, gender, diagnosis, diagnosis time, primary caregivers, and numbers of hospitalizations.
The Parent Perception of Uncertainty Scale (PPUS): Mishel developed PPUS to describe parents’ perceptions of uncertainty.10 PPUS is a 5-point Likert-type scale consisting of 31 items. The scale has four sub-dimensions: “Ambiguity” refers to the lack of clues or uncertainty regarding the planning or execution of the child’s care. “Lack of clarity” is related to the lack of clarity regarding receiving or perceiving information about the child’s treatment and care system. “Lack of information” refers to the absence of information regarding the diagnosis and severity of the condition. “Unpredictability” includes items related to the inability to make daily or future predictions about symptoms and disease outcomes. While the scale’s total Cronbach’s alpha value is 0.91, its subscales have Cronbach’s alpha values of 0.87, 0.81, 0.73, and 0.72, respectively. The lowest score to be obtained from the scale is 31, the highest score is 155, and an increase in the score indicates that the perception of uncertainty increases.10
Brief Symptom Inventory (BSI): The scale, developed by Derogatis33 as a short form of the 90-item Symptom Checklist (SCL-90-R), allows individuals to evaluate their psychological state across various dimensions and consists of 53 items. The scale has five sub-dimensions: “anxiety”, “depression”, “negative self”, “somatization” and “hostility”. BSI is a 5-point Likert-type scale; the total score that can be obtained from the scale varies between 0 and 212. A high total score indicates the frequency of psychological symptoms. The Turkish scale adaptation was conducted in two studies.34,35 These studies found that the internal consistency coefficient for the entire BSI varied between 0.95 and 0.96, and that of the subscales ranged between 0.55 and 0.86.
Statistical analysis
All validity and reliability analyses were conducted using SPSS 29 and AMOS 29. Participants’ characteristics were described with descriptive statistics. Expert opinions were examined with the content validity index (CVI) in the ‘language and appearance’ validity phase. Correlation coefficients were calculated to assess each item’s relationship with its sub-dimension, and corrected item-total correlations were used to minimize random measurement errors.36 The minimum value for corrected item-total item correlation coefficients was accepted as 0.3. In addition, the anti-image correlation matrix was calculated to determine whether the items were sufficiently related. The coefficients in the diagonal of the anti-image correlation matrix were examined to see whether they were greater than 0.5.37 The reliability analysis for the sub-dimensions was conducted using Cronbach’s alpha coefficient, including item deletion. A half reliability analysis was also performed, by calculating the Spearman-Brown coefficient. The data set’s suitability for factor analysis was assessed through the Kaiser-Meyer-Olkin (KMO) value and Bartlett’s test. Following these assessments, exploratory factor analysis was performed, and Cronbach’s alpha coefficients were recalculated for the new scale structure. The validity of the factor structure was evaluated using confirmatory factor analysis employing the indices given in Table I. Convergent validity was determined through Pearson correlation analysis between the scale’s total score and the BSI score, with all analyses conducted at a significance level of 0.05.
| AGFI, Adjusted Goodness of Fit Index; CFI, Comparative Fit Index; GFI, Goodness of Fit Index; IFI, Incremental Fit Index; NFI, Normed Fit Index; RFI, Relative Fit Index; RMSEA, Root Mean Square Error of Approximation; χ2/df, chi-square/degrees of freedom. |
||
| Table I. Criterion ranges of model fit indices. | ||
| Fit index | Perfect fit range | Acceptable fit range |
| χ2/df | 0≤ χ2/sd ≤2 | 2≤ χ2/sd ≤3 |
| AGFI | 0.90≤ AGFI≤1.00 | 0.85≤ AGFI≤0.90 |
| GFI | 0.95≤GFI≤1.00 | 0.90≤GFI≤0.95 |
| CFI | 0.95≤ CFI≤1.00 | 0.90≤ CFI≤0.95 |
| NFI | 0.95≤NFI≤1.00 | 0.90≤NFI≤0.95 |
| RFI | 0.95≤ RFI≤1.00 | 0.90≤ RFI≤0.95 |
| IFI | 0.95≤IFI≤1.00 | 0.90≤IFI≤ 0.95 |
| RMSEA | 0.00≤RMSEA≤0.05 | 0.05≤RMSEA≤0.08 |
Ethical considerations
Ethical approvals were obtained from Hacettepe University Health Sciences Research Ethics Committee, decision number GO22/13-66. Necessary permissions were also obtained from the hospitals, which allowed the research to be conducted.
Results
Sample characteristics
A total of 351 participants were included, with a mean age of 34.1±5.5 years, predominantly consisted of mothers (74.1%). Almost all parents were married (98.9%), and the majority had a high school education or higher (61.6%), with 73.8% reporting a medium income level. A minority (8.0%) were unsure of their child’s diagnosis, and nearly half (47.3%) reported caring for the child with their spouse. Parents rated the severity of the child’s illness at an average of 8.7±1.7. Approximately 45.9% of the children were under three years old, with a nearly equal gender distribution. Children had various chronic diagnoses, including heart conditions (20.8%), diabetes (15.1%), and epilepsy (14.2%). Most children had been hospitalized at least once (40.2%), and the duration of diagnosis was less than six months (Table II).
|
*Measured on a 10-point scale. SD, standard deviation. **Other diseases: cystic fibrosis, liver cyst, hearing loss, esophageal atresia, neuroblastoma, soft tissue sarcoma, cerebral palsy, eczema, juvenile idiopathic arthritis. |
|
| Table II. Characteristics of the sample. | |
| Characteristics |
|
| Parents’ age, years |
|
| Parents’ gender | |
| Mother |
|
| Father |
|
| Parents’ marital status | |
| Married |
|
| Single |
|
| Parents’ educational status | |
| Only literate |
|
| Elementary |
|
| Highschool |
|
| Bachelor’s |
|
| Postgraduate |
|
| Parents’ perceived income status | |
| Low |
|
| Medium |
|
| High |
|
| Parents’ knowledge of child's diagnosis | |
| Knows the right diagnosis |
|
| Misunderstands / does not know the diagnosis |
|
| Caregivers of child | |
| Mother |
|
| Mother and father |
|
| Mother, father, grandmother/mother-in-law |
|
| Mother and grandmother/mother-in-law |
|
| Other |
|
| Parents’ opinion of severity of the diagnosis* |
|
| Child's age | |
| 0-6 months |
|
| 7-12 months |
|
| 1-3 years |
|
| 4-5 years |
|
| 6-12 years |
|
| 13-18 years |
|
| Child's gender | |
| Boy |
|
| Girl |
|
| Child's diagnosis | |
| Heart failure |
|
| Diabetes |
|
| Epilepsy |
|
| Chronic renal failure |
|
| Thyroid disease |
|
| Asthma |
|
| Obesity |
|
| Other** |
|
| Time since child’s diagnosis | |
| 0-6 months |
|
| 7-12 months |
|
| 1-3 years |
|
| 4-5 years |
|
| 5+ years |
|
| No. of hospitalizations | |
| 0 |
|
| 1 |
|
| 2 |
|
| 3 |
|
| 4 |
|
| ≥ 5 |
|
Language, face, and content validity
After the translation processes were completed, all versions of the scale (see procedure section) were sent with a draft final form to 10 academics who are experts in the field of psychiatric nursing. Experts were asked to make a face evaluation regarding the understandability and necessity of each statement. In addition, for the first stage of content validity, experts rated the suitability of each statement on a scale from 1 to 4. In line with the experts’ opinions, the scale was finalized by a field expert, and the CVI was calculated. According to the Davis technique38, the CVI value, which is expected to be 0.8 and above, was found to be 0.96.
In the final stage of face and content validity, a pilot study was conducted with 20 parents who met the inclusion criteria. With the suggestion of five parents, a word (“expect”) was removed from one item of the scale (item 7) to make it more comprehensible. Thus, the item became clearer and more understandable in its Turkish version.
Internal consistency-1
As a result of the correlation analysis, the relationship between the items and the sub-dimension they belonged to was determined. The corrected correlation coefficient of the 29th item was below 0.3, and the item was deleted (Table III). After this stage, the analyses continued with 30 items. In the correlation analysis conducted to determine the relationship between the scale items and the total item, the correlation coefficient was found to be over 0.3 for all items, and as a result of the anti-image matrix, the diagonal values were over 0.5. The sub-dimension reliability analysis was calculated using the Cronbach alpha coefficient when the item was deleted. Cronbach’s alpha coefficient for the reliability of all scale items was found to be 0.945, 0.919 for ambiguity, 0.836 for lack of clarity, 0.796 for unpredictability, and 0.658 for lack of information. No item was excluded from the analysis at these stages. In addition, as a result of the split-half reliability analysis, the Cronbach alpha coefficient of the first part was found to be 0.912, and that of the second part was found to be 0.882. The Spearman-Brown coefficient value was found to be 0.926.
| A, ambiguity; LC, lack of clarity; LI, lack of information; U, unpredictability. | |||||||||||
| Table III. Corrected item-total correlation values in each sub-scale. | |||||||||||
| Ambiguity | Corrected item - Total correlation | Cronbach's alpha if item deleted | Lack of clarity | Corrected item - Total correlation | Cronbach's alpha if item deleted | Unpredictability | Corrected item - Total correlation | Cronbach's alpha if item deleted | Lack of information | Corrected item - Total correlation | Cronbach's alpha if item deleted |
| A_3 | 0.696 | 0.911 | LC_2 | 0.583 | 0.813 | U_11 | 0.820 | 0.463 | LI_1 | 0.483 | 0.669 |
| A_4 | 0.659 | 0.913 | LC_5 | 0.719 | 0.794 | U_19 | 0.704 | 0.693 | LI_12 | 0.387 | 0.672 |
| A_8 | 0.728 | 0.91 | LC_6 | 0.59 | 0.813 | U_23 | 0.695 | 0.709 | LI_26 | 0.441 | 0.594 |
| A_13 | 0.695 | 0.911 | LC_7 | 0.568 | 0.817 | U_27 | 0.755 | 0.588 | LI_28 | 0.422 | 0.600 |
| A_15 | 0.705 | 0.911 | LC_9 | 0.549 | 0.817 | LI_30 | 0.327 | 0.641 | |||
| A_16 | 0.651 | 0.913 | LC_10 | 0.595 | 0.809 | ||||||
| A_17 | 0.583 | 0.916 | LC_14 | 0.431 | 0.836 | ||||||
| A_18 | 0.782 | 0.907 | LC_29 | 0.197 | - | ||||||
| A_20 | 0.57 | 0.916 | LC_31 | 0.484 | 0.828 | ||||||
| A_21 | 0.71 | 0.911 | |||||||||
| A_22 | 0.554 | 0.917 | |||||||||
| A_24 | 0.711 | 0.911 | |||||||||
| A_25 | 0.443 | 0.920 | |||||||||
Exploratory factor analysis
The KMO value indicating the suitability of the data set for factor analysis was found to be 0.937, and Bartlett’s test was found to be significant (x2 [435]:5738.180 , p=0.0001). In the factor analysis, items 1, 2, 12, 21, and 25 were excluded because they had high loadings on different sub-dimensions, and items 17 and 20 were excluded from the analysis because they had low factor loadings. A structure with four sub-dimensions was obtained with the remaining 23 items (Table IV). The first sub-dimension explained 38.677% of the variance, the second sub-dimension explained 8.418% of the variance, the third sub-dimension explained 5.921% of the variance, and the fourth sub-dimension explained 14.966%. The total variance explained by the four sub-dimensional structures was 57.982%. Eigenvalues were determined to be 8.896, 1.936, 1.362, and 1.142 in the sub-dimensions.
| A, ambiguity; LC, lack of clarity; LI, lack of information; U, unpredictability. | ||||
| Table IV. Exploratory factor analysis with Varimax rotation. | ||||
| Items |
|
|||
|
|
|
|
|
|
| A_16 |
|
|||
| A_15 |
|
|||
| A_4 |
|
|||
| A_18 |
|
|||
| A_3 |
|
|||
| A_24 |
|
|||
| A_8 |
|
|||
| A_13 |
|
|||
| A_22 |
|
|||
| LC_7 |
|
|||
| LC_5 |
|
|||
| LC_14 |
|
|||
| LC_10 |
|
|||
| LC_6 |
|
|||
| LC_9 |
|
|||
| LC_31 |
|
|
||
| U_19 |
|
|||
| U_23 |
|
|||
| U_27 |
|
|||
| U_11 |
|
|||
| LI_30 |
|
|||
| LI_28 |
|
|||
| LI_26 |
|
|||
At this stage, it was also tested whether a single score could be obtained from the 23 items and four sub-dimensions obtained from the exploratory factor analysis, in other words, the additivity feature. ANOVA with Tukey’s test for nonadditivity showed that the 23 items forming the scale were homogeneous and interrelated (p=0.0001), and the items confirmed additivity (p=0.0001).
Internal consistency-2
As a result of the exploratory factor analysis, the Cronbach alpha value for the entire scale was 0.923, for ambiguity 0.906, for lack of clarity 0.813, for unpredictability 0.801, and for lack of information was 0.860. As a result of the split-half reliability analysis, the Cronbach alpha coefficient of the first part was found to be 0.913, and for the second part, 0.811. On the other hand, Spearman-Brown coefficient value was found to be 0.830.
Confirmatory factor analysis
Fig. 1. gives the path diagram of the confirmatory factor analysis conducted to test whether the factor structure obtained as a result of the exploratory factor analysis was valid. Four of the fit indices showed an “acceptable” level of model fit, while the others showed an “excellent” level of model fit.
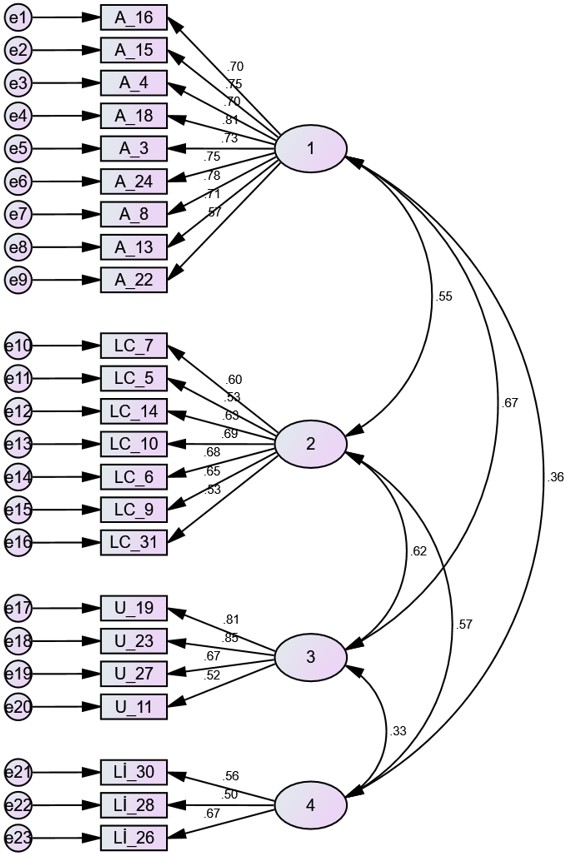
A, ambiguity; AGFI, Adjusted Goodness of Fit Index; CFI, Comparative Fit Index; GFI, Goodness of Fit Index; IFI, Incremental Fit Index; LC, lack of clarity; LI, lack of information NFI, Normed Fit Index; RFI, Relative Fit Index; RMSEA, Root Mean Square Error of Approximation; U, unpredictability; χ2/df, chi-square/degrees of freedom.
Convergent validity
BSI was used to determine the scale’s convergent validity. The BSI had a positive, significant relationship with the overall score of the scale (r=0.69) and the subscales (0.64; 0.57; 0.50; 0.41, respectively; Table V).
|
SD, standard deviation. *p<0.001 |
||||||
| Table V. Correlation between Parental Uncertainty Perception Scale-Turkish Form score and general psychological symptoms of the Brief Symptom Inventory. | ||||||
| Variables (Mean ± SD) | Parents’ perception of uncertainty (63.29±17.42) | Ambiguity (27.88±8.98) | Lack of clarity (16.70±5.68) | Unpredictability (12.47±3.94) | Lack of information (6.22±2.48) | Psychological symptoms (43.58±28.64) |
| Psychological symptoms | 0.69* | 0.64* | 0.57* | 0.50* | 0.41* | 1.00 |
Discussion
This study aimed to determine whether PPUS is a valid and reliable tool for measuring Turkish parents’ perceptions of uncertainty. Within the scope of the literature review, since the full text of the study was not available in a summary report27 regarding the psychometric properties of the Turkish version of the PPUS, the detailed analyses of the scale could not be examined. In addition, to our knowledge no study was found in Türkiye using this scale. In this case, it was thought that due to the lack of details regarding validity and reliability analyses, a sufficient reference was not provided to the literature, and the scale’s suitability for Turkish culture could not be fully assessed. Considering the persistent need to assess the uncertainty perceptions of parents of children with chronic diseases in Türkiye, this study addresses this gap by presenting a thorough adaptation process along with comprehensive validity and reliability analyses of the PPUS, thereby making a substantial contribution to the existing literature.
In our study, PPUS-TR provided high face and validity in line with the original scale. The 29th item in the “lack of clarity” sub-dimension of the original scale was deleted because it had a low coefficient in the correlation analysis in which its relationship with the sub-dimension it belonged to was determined. This item refers to the expression of trust by the parents that nurses will be present when needed. While all other items emphasize aspects such as the severity of the child’s illness, assuming responsibility for the child’s care, and understanding the illness process, this particular item focuses solely on trust in nurses. In this context, item 29 may have shown a low correlation, as it does not fall under any of the subscales due to its distinctiveness from the other items and the fact that its direct relationship with uncertainty is not immediately clear. Similarly, in the Chinese adaptation of the scale, item 29 was removed from the scale due to its low associations with the rest of the scale.20 As a result of the KMO value (0.937) and Bartlett test (p=0.0001) used to evaluate the suitability and adequacy of the sample size for the analysis for construct validity, it was found that the sample size was sufficient for factor analysis. In the exploratory factor analysis, items 1, 2, 12, 17, 20, 21 and 25 were deleted. The removal of items 1, 2, 12, 21, and 25 due to high loadings on different sub-dimensions indicates that these items lacked specificity to a single construct, potentially introducing conceptual overlap across factors. Additionally, the removal of items 17 and 20 because of low factor loadings highlights that these items may not adequately represent the latent constructs being measured. Despite the deleted items, the factor structure of the scale in our study overlaps with the factor structure of the original scale.10 The confirmatory factor analysis results show that the model fit indices are sufficient and the model is valid. In addition, the four factors that explain 57.982% of the total variance due to the factor analysis show that the scale has significant structural validity in the Turkish sample. This supports the fact that the scale’s factor structure is also suitable for Turkish parents. Similar findings were obtained in other studies where PPUS was adapted to different cultures17-20, and it was emphasized that PPUS is a tool that can be adapted to different cultures.
When reliability analyses were evaluated, the fact that Cronbach alpha coefficients were found to be relatively high indicates that the scale’s internal consistency is strong. Cronbach alpha coefficient was 0.860 in the Spanish version19, 0.930 in the Arabic version17, and 0.825 in the cancer-specific adapted Chinese version.20 In this study, the total Cronbach alpha coefficient of the scale was 0.923, and for the sub-dimensions, it varied between 0.801 and 0.906, confirming that the scale and its sub-dimensions are reliable. At the same time, the high results of the split-half reliability analyses (Cronbach alpha of first part: 0.913, of second part: 0.811) reveal that the scale gives consistent results at a general level. These findings show that the scale is a reliable tool. In addition, the significant positive correlation between PPUS and BSI (r=0.69) supports the convergent validity of the PPUS, suggesting that parents’ perceptions of uncertainty may be meaningfully associated with psychological symptoms such as depression and anxiety. In another study where both the PPUS and BSI were used together, a significant positive correlation between these two scales was found.39 Additionally, in other studies using the PPUS, consistent with the findings of our study, parents’ perception of uncertainty was significantly related to factors such as anxiety, depression, and stress.20,40,41
According to the analyses, PPUS-TR has taken its final form with 23 items and a 4-factor structure. However, there are some limitations to this study. First, the predominance of mothers among participants may affect the generalizability of the findings to all parents. Additionally, the study was limited to hospitals in one city, potentially overlooking cultural and socioeconomic differences. In addition, the sample consists of parents of children with many different types of chronic diseases; the results may differ in a sample consisting only of specific patient groups. Therefore, the authors recommend using the scale in future studies in samples where mothers and fathers are equally distributed in different geographical regions and specific disease groups. In addition, since our sample includes parents of children aged 0–18 years, the authors also recommend examining parental perceptions of uncertainty in the context of different age groups.
In conclusion, this study demonstrates that the PPUS-TR is a valid and reliable tool for measuring the perception of uncertainty among Turkish parents. At the same time, further studies with more diverse and extensive samples may help better understand the role of uncertainty perception in the disease process and determine which factors affect this uncertainty perception. Adding the Turkish version of the scale to adaptation studies conducted in different cultures through this study may also pave the way for comparative studies on how parents’ uncertainty perception is shaped in various cultural contexts.
Ethical approval
The study was approved by Hacettepe University Health Sciences Research Ethics Committee (date: 06.09.2022, number: GO22/13-66). Necessary permissions were also obtained from the hospitals, which allowed the research to be conducted. Informed consent was obtained from all participants.
Source of funding
The authors declare the study received no funding.
Conflict of interest
The authors declare that there is no conflict of interest.
References
- Mishel MH. Uncertainty in illness. Image J Nurs Sch 1988; 20: 225-232. https://doi.org/10.1111/j.1547-5069.1988.tb00082.x
- Zhang Y. Uncertainty in illness: theory review, application, and extension. Oncol Nurs Forum 2017; 44: 645-649. https://doi.org/10.1188/17.ONF.645-649
- Ni C, Peng J, Wei Y, et al. Uncertainty of acute stroke patients: a cross-sectional descriptive and correlational study. J Neurosci Nurs 2018; 50: 238-243. https://doi.org/10.1097/JNN.0000000000000373
- Perrett SE, Biley FC. Negotiating uncertainty: the transitional process of adapting to life with HIV. J Assoc Nurses AIDS Care 2013; 24: 207-218. https://doi.org/10.1016/j.jana.2012.06.007
- Osmanağaoğlu N, Creswell C, Dodd HF. Intolerance of uncertainty, anxiety, and worry in children and adolescents: a meta-analysis. J Affect Disord 2018; 225: 80-90. https://doi.org/10.1016/j.jad.2017.07.035
- MacLennan K, Rossow T, Tavassoli T. The relationship between sensory reactivity, intolerance of uncertainty and anxiety subtypes in preschool-age autistic children. Autism 2021; 25: 2305-2316. https://doi.org/10.1177/13623613211016110
- Gramszlo C, Fogleman ND, Rosen PJ, Woodruff-Borden J. Intolerance of uncertainty in children with attention-deficit/hyperactivity disorder. Atten Defic Hyperact Disord 2018; 10: 189-197. https://doi.org/10.1007/s12402-017-0244-7
- Fortier MA, Batista ML, Wahi A, Kain A, Strom S, Sender LS. Illness uncertainty and quality of life in children with cancer. J Pediatr Hematol Oncol 2013; 35: 366-370. https://doi.org/10.1016/j.jpain.2012.01.091
- Bailey DJ, Stewart J. Merle Mishel: Uncertainty in Illness Theory. In: Nursing Theorists and Their Work. 8th ed. Elsevier; 2014: 555-573.
- Mishel MH. Parents’ perception of uncertainty concerning their hospitalized child. Nurs Res 1983; 32: 324-330.
- Petrongolo JL, Zelikovsky N, Keegan RM, Furth SL, Knight A. Examining uncertainty in illness in parents and children with chronic kidney disease and systemic lupus erythematosus: a mediational model of internalizing symptoms and health-related quality of life. J Clin Psychol Med Settings 2020; 27: 31-40. https://doi.org/10.1007/s10880-019-09617-3
- Gunter MD, Duke G. Reducing uncertainty in families dealing with childhood cancers: an integrative literature review. Pediatr Nurs. 2018; 44(1): 21-37.
- Tiwaree C, Kantawng S, Wonghongkul T, Lertwatthanawilat W. Predicting factors of uncertainty in illness among children with leukemia undergoing chemotherapy. Pac Rim Int J Nurs Res. 2016; 20(1): 33-44.
- Page MC, Fedele DA, Pai AL, et al. The relationship of maternal and child illness uncertainty to child depressive symptomotology: a mediational model. J Pediatr Psychol 2012; 37: 97-105. https://doi.org/10.1093/jpepsy/jsr055
- Al-Yateem N, Brenner M, Alrimawi I, Al-Shujairi A, Al-Yateem S. Predictors of uncertainty in parents of children living with chronic conditions. Nurs Child Young People 2019; 33: e1102. https://doi.org/10.7748/ncyp.2019.e1102
- Malin KJ, Johnson TS. A concept analysis of parental uncertainty in illness of an infant. MCN Am J Matern Child Nurs 2019; 44: 206-211. https://doi.org/10.1097/NMC.0000000000000535
- Al-Yateem N, Brenner M, Ahmad A, Rahman SA. Evaluating the reliability and validity of the Arabic Version of the Parents Perceptions of Uncertainty Scale (A-PPUS). J Pediatr Nurs 2017; 36: 179-185. https://doi.org/10.1016/j.pedn.2017.06.017
- Mai J, Xie W, MA C, Deng Y, Dai L. Initial revision of Chinese version of parents’ perception of uncertainty scale. Chin J Pract Nurs. 2013; 29(28): 46-50.
- Suarez-Acuña CE, Carvajal-Carrascal G, Serrano-Gómez ME. Psychometric properties of the parent’s perception uncertainty in illness scale, Spanish version. Enferm Intensiva (Engl Ed) 2018; 29: 149-157. https://doi.org/10.1016/j.enfi.2017.12.002
- Ye ZJ, Liu ML, Zhang Z, et al. Psychometric properties of the Chinese version of the Parent Perception of Uncertainty Scale (PPUS) among parents of children with cancer diagnosis. Int J Nurs Sci 2017; 4: 278-284. https://doi.org/10.1016/j.ijnss.2017.05.004
- Lin L, Yeh CH, Mishel MH. Evaluation of a conceptual model based on Mishel’s theories of uncertainty in illness in a sample of Taiwanese parents of children with cancer: a cross-sectional questionnaire survey. Int J Nurs Stud 2010; 47: 1510-1524. https://doi.org/10.1016/j.ijnurstu.2010.05.009
- Wang J, Howell D, Shen N, et al. Multimedia appendix correction: mHealth supportive care intervention for parents of children with acute lymphoblastic leukemia: quasi-experimental pre- and postdesign study. JMIR Mhealth Uhealth 2019; 7: e13159. https://doi.org/10.2196/13159
- Wang KWK, Chen IH, Chen M. Uncertainty of parents with children undergoing herniorrhaphy. Clin Nurs Res 2018; 27: 343-363. https://doi.org/10.1177/1054773816676942
- Zhao N, Xie W, MA C, Fan L, Liang C. Study on correlation between illness uncertainty and coping styles of parents of children with diabetes mellitus. Chin J Pract Nurs. 2016: 36: 1542-1546.
- Demirtepe-Saygılı D, Bozo Ö. Affective experiences of the parents of children with cancer: a qualitative study. Curr Psychol. 2020; 39(6): 2211-2220. https://doi.org/10.1007/s12144-018-9905-8
- Pars H, Soyer Ö, Şekerel BE. The experiences, perceptions and challenges of mothers managing asthma in their children: a qualitative study. Turk J Pediatr 2020; 62: 734-745. https://doi.org/10.24953/turkjped.2020.05.004
- Özkan S, Taş Arslan F. Psychometric properties of the Turkish version of the Parent Perception of Uncertainty Scale (PPUS) among parents of hospitalized children. In: 10th Excellence in Pediatrics Conference, 2018; Prague.
- Alpar R. Uygulamalı istatistik ve geçerlik-güvenirlik: Spor, sağlık ve eğitim bilimlerinden örneklerle. Ankara: Detay Yayıncılık; 2020: 557-559.
- Streiner DL, Norman GR, Cairney J. Health measurement scales: a practical guide to their development and use. USA: Oxford University Press; 2015: 273-300. https://doi.org/10.1093/med/9780199685219.001.0001
- International Test Commission. ITC guidelines for the large-scale assessment of linguistically and culturally diverse populations. International Journal of Testing 2019; 19: 301-336. https://doi.org/10.1080/15305058.2019.1631024
- Beaton DE, Bombardier C, Guillemin F, Ferraz MB. Guidelines for the process of cross-cultural adaptation of self-report measures. Spine (Phila Pa 1976) 2000; 25: 3186-3191. https://doi.org/10.1097/00007632-200012150-00014
- Madeo AC, O’Brien KE, Bernhardt BA, Biesecker BB. Factors associated with perceived uncertainty among parents of children with undiagnosed medical conditions. Am J Med Genet A 2012; 158A: 1877-1884. https://doi.org/10.1002/ajmg.a.35425
- Derogatis LR. Brief symptom inventory. Baltimore, MD: Clinical Psychometric Research; 1975.
- Sahin NH, Durak A. A study of the brief symptom inventory in Turkish youth. Turkish Journal of Psychology 1994; 9: 44-56.
- Şahin HN, Uğurtaş S, Durak Batıgün A. The validity, reliability and factor structure of the Brief Symptom Inventory (BSI). Turk Psikiyatri Derg 2002; 13: 125-135.
- Rosner B, Willett WC. Interval estimates for correlation coefficients corrected for within-person variation: implications for study design and hypothesis testing. Am J Epidemiol 1988; 127: 377-386. https://doi.org/10.1093/oxfordjournals.aje.a114811
- Güvendir MA, Özkan YÖ. Item removal strategies conducted in exploratory factor analysis: a comparative study. International Journal of Assessment Tools in Education 2022; 9: 165-180. https://doi.org/10.21449/ijate.827950
- Davis LL. Instrument review: getting the most from a panel of experts. Appl Nurs Res 1992; 5: 194-197. https://doi.org/10.1016/S0897-1897(05)80008-4
- Chaney JM, Gamwell KL, Baraldi AN, et al. Parent perceptions of illness uncertainty and child depressive symptoms in juvenile rheumatic diseases: examining caregiver demand and parent distress as mediators. J Pediatr Psychol 2016; 41: 941-951. https://doi.org/10.1093/jpepsy/jsw004
- Li Q, Luo C, Ye J, et al. Relationship between illness uncertainty and family resilience among caregivers of stroke patients in Chinese nuclear families: the mediating role of perceived stress. Patient Prefer Adherence 2024; 18: 1095-1105. https://doi.org/10.2147/PPA.S463562
- Lv M, Feng-Fang Y, Wang Y, Zhen-Xu H. Factors contributing to emotional distress when caring for children with imperforate anus: a multisite cross-sectional study in China. Front Med (Lausanne) 2023; 10: 1088672. https://doi.org/10.3389/fmed.2023.1088672
License
Copyright (c) 2025 The Author(s). This is an open access article distributed under the Creative Commons Attribution License (CC BY), which permits unrestricted use, distribution, and reproduction in any medium or format, provided the original work is properly cited.