Abstract
Background. Assessment of volume overload and determination of dry weight are essential for children on hemodialysis (HD). This study aimed to compare the effectiveness of lung ultrasound (LUS)-derived B-lines and electrical cardiometry (EC)-derived thoracic fluid content (TFC) scores in detecting volume overload in pediatric patients undergoing maintenance HD.
Methods. This cross-sectional study was conducted on 50 patients aged 5 to 18 years, both sexes, with kidney failure on maintenance HD three times weekly. Dry weight was determined for each patient by a pediatric nephrologist based on a clinical assessment of hydration status (absence of edema, pulmonary rales, hypertension, intradialytic hypotension or cramps) and supported by bioimpedance spectroscopy values to estimate overhydration. Patients who did not reach dry weight at the end of the session were defined as the non-dry weight group (N=21) and those who did were defined as the dry weight (N=29) groups. Correlations of B-lines and TFC with clinical parameters and the diagnostic performance of these methods in predicting hypervolemia (ROC analysis) were analyzed.
Results. Before dialysis, TFC and B-line scores did not differ significantly between the dry-weight and non-dry-weight groups (P>0.05), but were significantly lower after the HD session in the dry weight group than in the non-dry weight group (P < 0.001). TFC and B-line scores could significantly predict hypervolemia (areas under the curve [AUC]: 0.750 and 0.801, respectively). In the same order the cut off values were >31 kOhm⁻¹ and >17, sensitivities were 76.19% and 80.95%, and specificities were 55.71% and 75.86%, respectively. TFC was comparable to the B-line score in the prediction of hypervolemia (P=0.585, difference between AUCs=0.050; 95% confidence interval: -0.132 to 0.234).
Conclusions. Both LUS and EC are valuable bedside methods for assessing volume overload in pediatric HD patients. However, EC is not as dependent on operator skills and may be a valuable tool in clinical practice, especially in settings where LUS might be challenging to perform.
Keywords: lung ultrasound, electrical cardiometry, extravascular lung water, hemodialysis, pediatric
Introduction
Determining the ideal weight goal based on optimum fluid levels is challenging in children undergoing hemodialysis (HD).1 Fluid overload stands as a distinct cardiovascular risk factor in pediatric HD patients.2 Chronic excess fluid in the body is linked to heart-related health issues and death. However, excessive removal of fluid during HD may lead to cardiac stunning, hypotension, and earlier loss of residual kidney function.3,4
Optimizing the target weight for children undergoing HD is difficult due to multiple factors.1 Pediatric dry weight fluctuates due to growth and might decrease dramatically during illnesses. Dry weight is mainly established by clinical evaluation, in which fluid assessment is subjective and inaccurate. Dry weight represents a clinically determined lowest post-dialysis body weight that the patient can tolerate without symptoms of hypovolemia.5
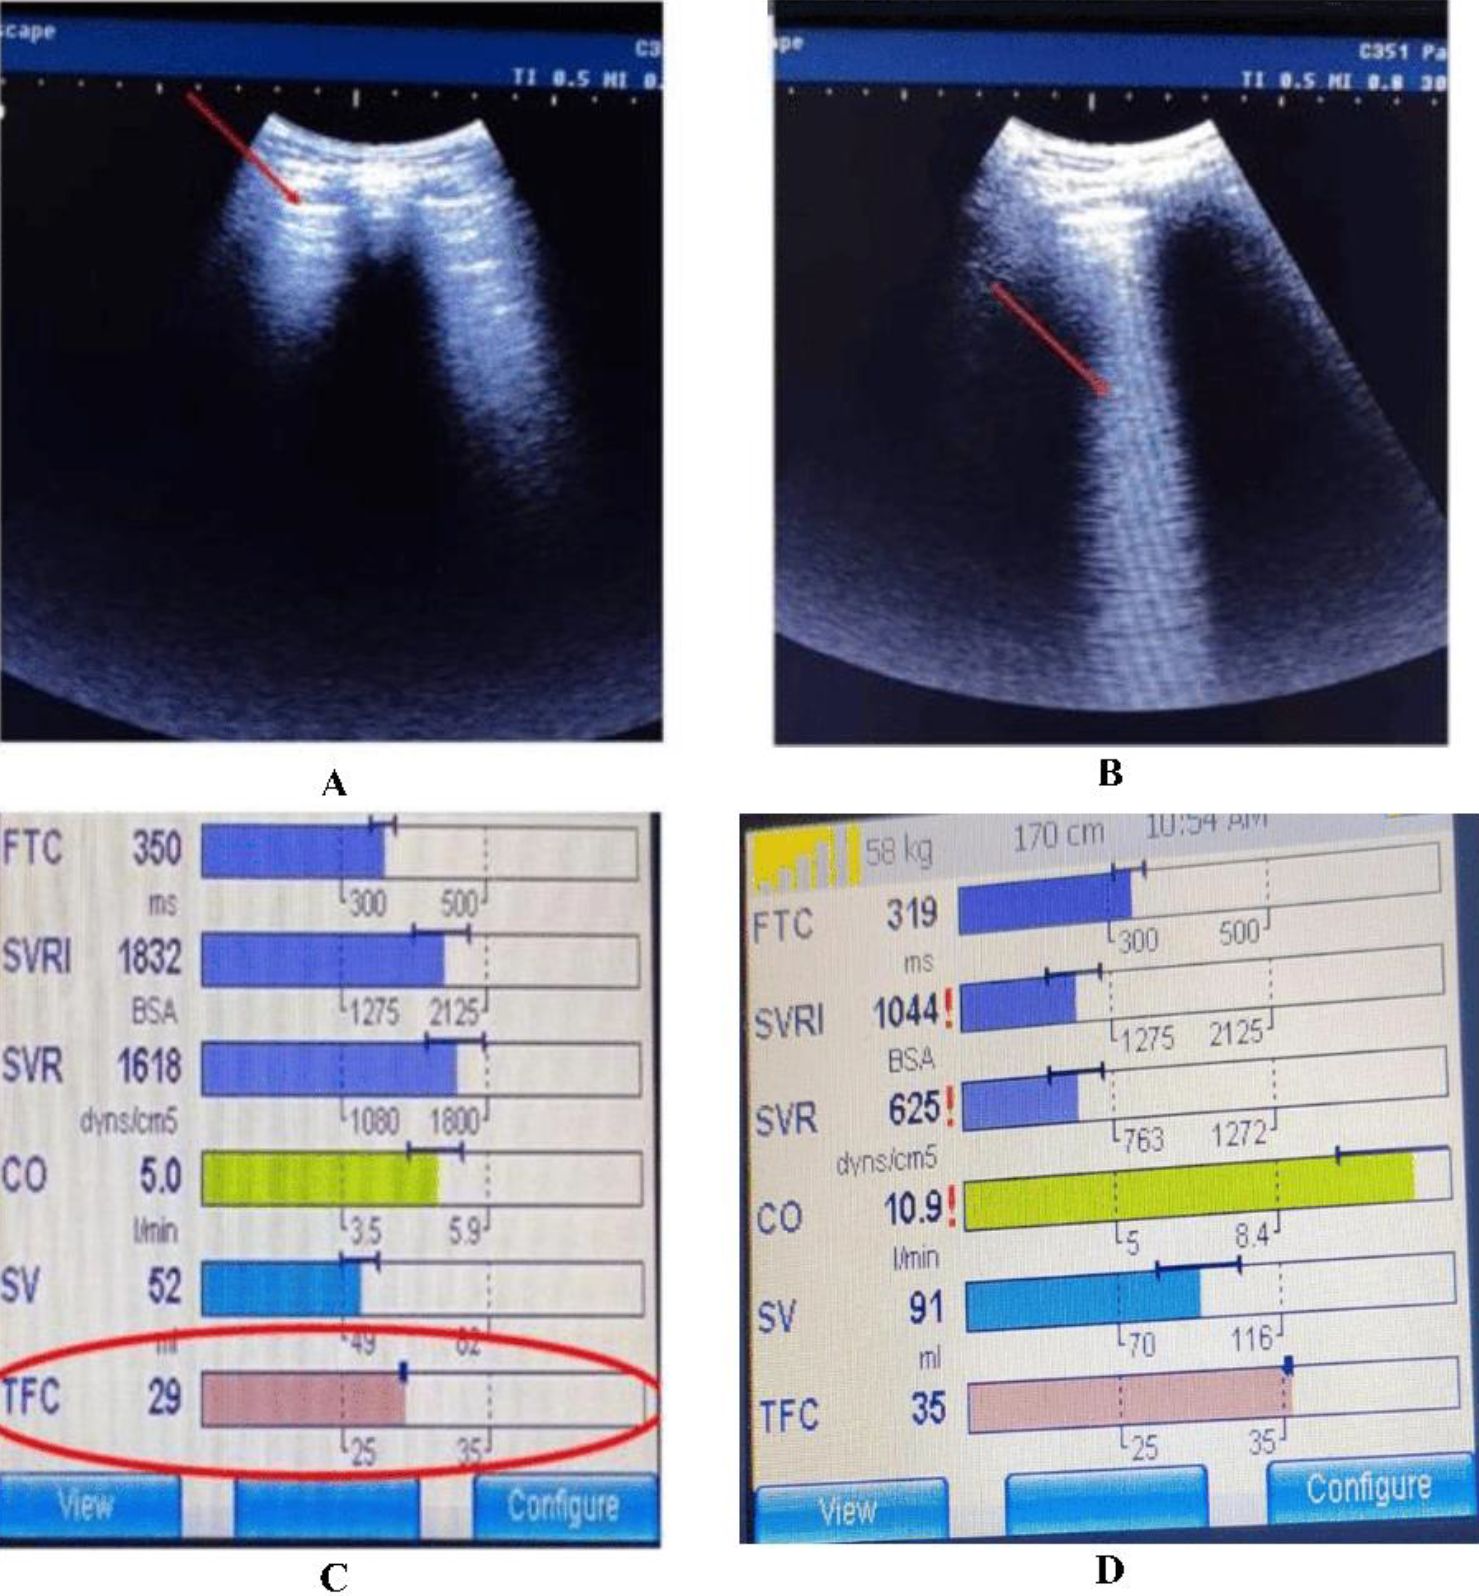
In recent years, various non-invasive objective techniques have been developed for monitoring hemodynamics and assessing fluid status.6 Lung ultrasound (LUS) detects extravascular lung water (EVLW) as an indicator of systemic fluid overload in adults receiving HD and peritoneal dialysis.7 EVLW may be detected with sonography by observing linear artifacts from enlarged interlobular septa and other subpleural structures.8 The increase in lung density is due to transudate, which can cause reflection of the ultrasound (US) beam, resulting in bright, vertical lines called B-lines along the pleural line. The number of B-lines can be quantified using LUS and has been found to correspond to the amount of EVLW in adult patients.1 In euvolemic patients, B-lines are typically absent. They may appear before clinical symptoms or signs of fluid excess.9
Electrical cardiometry (EC) measures cardiac output, thoracic fluid content (TFC), and additional hemodynamic parameters. It derives cardiac output from thoracic electrical bioimpedance (TEB) measurements.10 TEB refers to the impedance encountered by high-frequency, low-amplitude electrical current passing through the upper and lower thorax electrodes. This measured impedance inversely correlates with the volume of thoracic fluids, meaning that higher thoracic fluid levels lead to reduced TEB values.11
TFC is the combined volume of fluids in the chest cavity, including intravascular and extravascular fluid. Alterations in TFC may indicate changes in total fluid status. Therefore, EC values are essential for monitoring thoracic blood volume changes during HD sessions.12
Although the effectiveness of LUS and EC in detecting volume overload has been compared in intensive care units, especially for predicting weaning13, studies involving pediatric patients undergoing maintenance HD are limited.
Thus, this study aimed to compare the effectiveness of EC and LUS in detecting volume overload in pediatric patients undergoing maintenance HD, using clinically determined dry weight as the reference standard.
Materials and Methods
This cross-sectional study was carried out on 50 patients, of both sexes, aged 5 to 18 years, with kidney failure on maintenance HD three times weekly. The research was conducted from May 2023 to March 2024 after approval from the Ethics Committee (approval code: 36264PR187/4/23 , date: 15/04/2023). Informed written consent was obtained from the patients’ guardians.
Coexisting interstitial lung disease, atelectasis, lung fibrosis, heart failure, and implantable cardiac pacemakers or defibrillators were deemed exclusion criteria.
All patients underwent medical history taking and physical examination. Pre- and postdialysis weights were recorded, and their systolic and diastolic blood pressure (SBP and DBP) values were measured and then presented as percentiles.14 In this study, the patients did not have residual urine output, and only hypervolemic patients before dialysis were included.
Interdialytic weight gain (IDWG) was defined as the increase in body weight between two consecutive hemodialysis sessions and was calculated as the difference between predialysis weight and the postdialysis weight of the previous session.15
Interdialytic weight gain percentage (IDWG %) was calculated as follows: [(predialysis weight − previous postdialysis weight) / dry weight] × 100.16
Dry weight was defined as the postdialysis weight at which the child is clinically euvolemic, with no signs of fluid overload or dehydration.17
Delta weight was defined as the difference between postdialysis weight and dry weight.17 Delta weight percentage (Delta weight %) was calculated as [(postdialysis weight − dry weight) / dry weight] × 100.
Dry weight was determined for each patient by a single pediatric nephrologist before starting the study5, based on a comprehensive clinical evaluation of the patients’ hydration status and bioimpedance spectroscopy (BIS). The clinically proper dry weight was defined as the lowest post-dialysis weight a patient could tolerate without exhibiting signs or symptoms of either overhydration or dehydration during or after dialysis. This determination involved assessing the patient’s clinical condition, including the presence or absence of peripheral or generalized edema, chest discomfort, pleural effusion, or pulmonary edema. Intradialytic symptoms such as muscle cramps, dizziness, and hypotension were also reviewed through medical records.
The nephrologist’s judgment was further supported by reference to dry weight estimated using BIS (TANITA MC-980MA-N Plus II, Japan, 2018), calculated as the pre-dialysis body weight minus the overhydration value measured by BIS. The final clinically proper dry weight combined clinical insights with BIS data, ensuring that the determined weight minimized symptoms associated with fluid imbalance.
Hypervolemia was defined as present when the patients’ weight was higher than the determined dry weight. Patients who reached the clinically determined dry weight after dialysis were classified as the dry weight group, and those who remained hypervolemic were classified as the non-dry weight group. To minimize potential measurement bias, LUS and EC evaluations were conducted by independent investigators who were blinded to the clinical volume status and BIS measurements. All patients in this study were anuric. All patients were hypervolemic before the dialysis session during which the study interventions were performed.
Lung ultrasound evaluation
A physician with expertise in bedside US examinations using a SonoScape® system (A6, Shenzhen, China) equipped with a Linear Probe (6-13 MHz). The thorax was divided into 12 zones (six on each side: anterior-upper (U) R1, anterior-lower (L) R2; lateral-U R3, lateral-L R4; posterior-U R5, posterior-L R6; and similar zones on the left side: front U-L1, front-L L2; lateral-U L3, lateral-L L4; rear-U L5, rear-L L6) to check for the presence of A-lines (normal transverse shadows) or B-lines. B-lines were defined as vertical, hyperechoic artifacts that arise from the pleural line and extend to the bottom of the screen without fading. The B-line score was determined by summing the number of B-lines in the 12 lung zones. A higher B-line score indicates increased EVLW.18
Electrical cardiometry evaluation
An EC monitor (ICON®, Cardiotronics, Inc., La Jolla, CA, USA; Osypka Medical GmbH, Berlin, Germany) was utilized. The patients’ data were entered. The device measured several hemodynamic parameters, such as TFC, cardiac index, and systemic vascular resistance. The ICON device was linked to 4 electrocardiogram electrodes that were applied to the patients’ skin after alcohol cleansing. Two electrodes were positioned at the left mid-axillary line, specifically at the level of the xiphoid process, and another 5 cm below this point, one below the left ear in the neck, and one just above the left clavicular midpoint.
B-lines of LUS and EC parameters were assessed 30 minutes before and 30 minutes after a single mid-week dialysis session. Both approaches were evaluated in terms of their specificity and sensitivity.
The patients underwent intermittent HD sessions using the Fresenius 4008 B HD machine (Germany) with blood flow rate of 5 mL/kg/min. The HD sessions utilized polysulphane hollow fiber dialyzers appropriate for the patients’ surface area (Fresenius F3 = 0.4 m2, F4 = 0.7 m2, F5 = 1.0 m2, and F6 = 1.2 m2). Bicarbonate HD solutions were utilized, and patients were given supportive therapy, including erythropoietin injections, oral calcium supplements, one alpha agonist, folic acid, and antihypertensive medications such as angiotensin-converting enzyme (ACE) inhibitors and beta blockers for those with hypertension.
The study’s primary outcome was the evaluation of volume status in pediatric patients on maintenance HD by LUS and EC. The secondary outcome was the comparison of the specificity and sensitivity of each method.
Sample size calculation
The sample size calculation was performed using G*Power 3.1.9.2 (Universität Kiel, Germany). According to a previous study19, the mean ± SD of the B-line score before HD was 59.6 ± 42.8, and the B-line score after HD was 32.7 ± 27.9. The sample size was determined based on the following considerations: a 0.74 effect size, a 95% confidence interval (CI), and a study power of 95%. Two cases were added to each group to compensate for potential dropouts. Therefore, a total of 50 patients were recruited.
Statistical analysis
The statistical analysis was performed using SPSS version 27 (IBM©, Armonk, NY, USA). The Shapiro-Wilks test and histograms were used to determine whether the data distribution was normal. To evaluate quantitative parametric data, expressed as mean ± standard deviation (SD), the unpaired Student’s t-test was used. Fisher’s exact test or the chi-square test was used to evaluate qualitative variables expressed as percentages or frequencies. Pearson’s correlation analysis was used to determine the correlation between quantitative variables. Post-dialysis values for SBP percentile, TFC, and B-lines were used for the correlation analysis. ROC curve analysis was used to determine the overall diagnostic performance. Statistical significance was defined as two-tailed p values less than 0.05.
Results
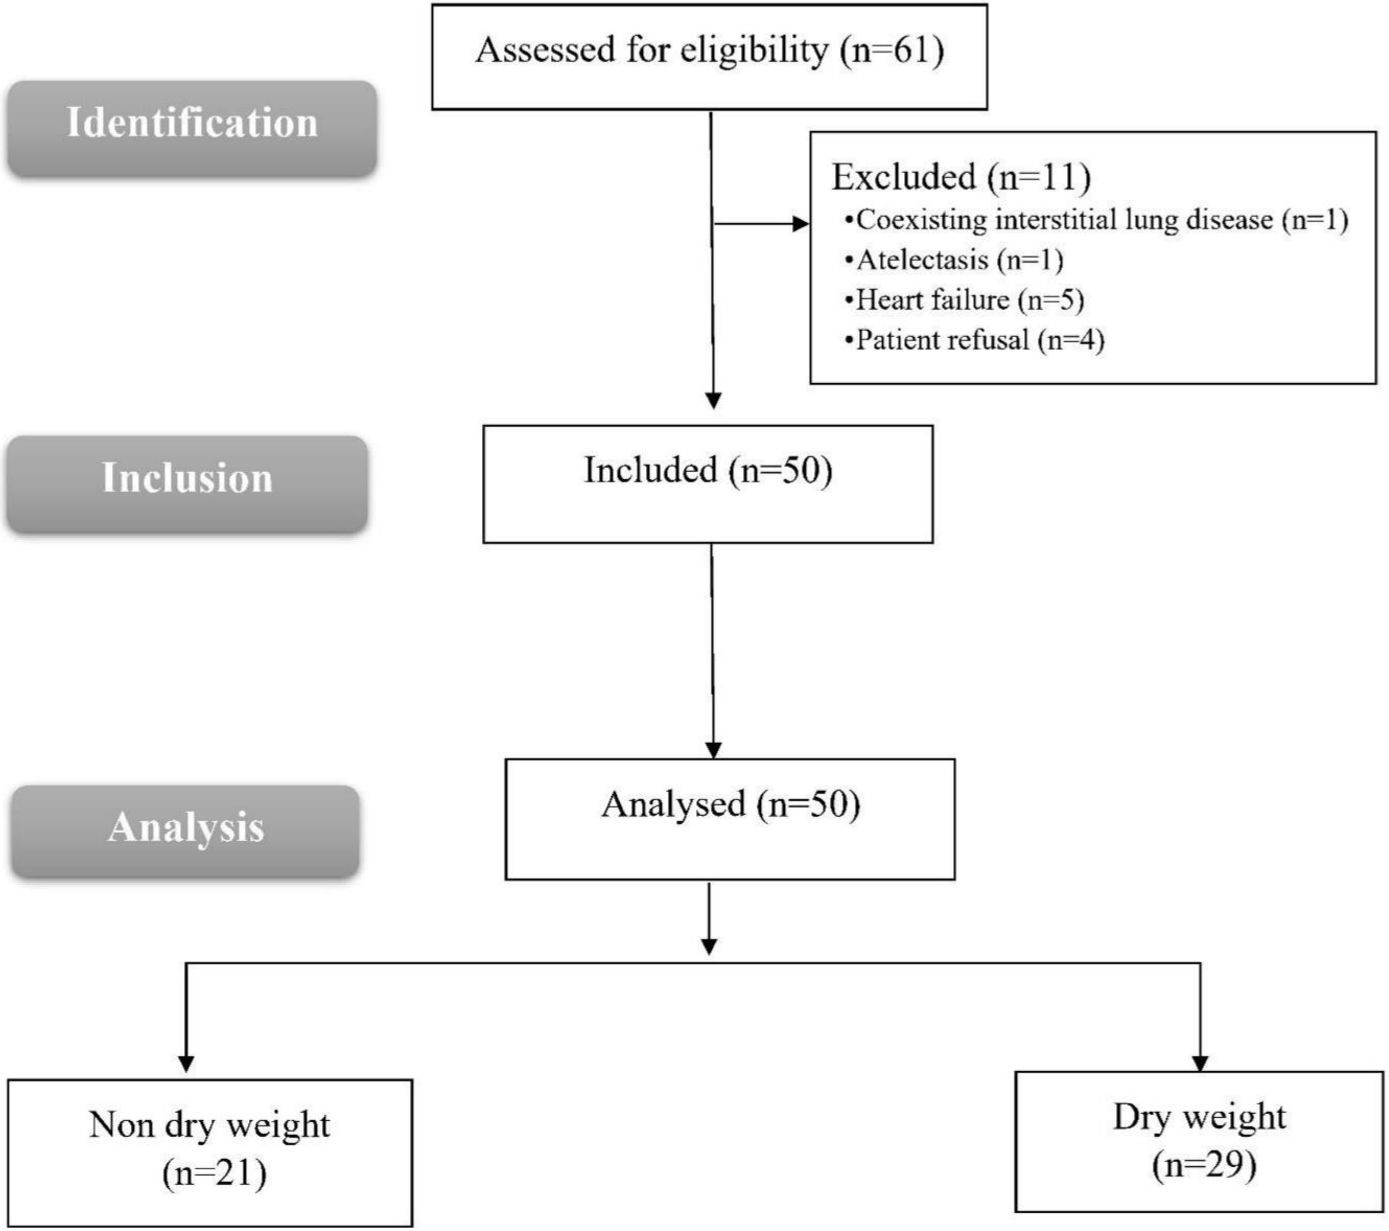
Eligibility was determined for 61 patients in this study. Seven failed to meet the requirements, and four refused to participate. The remaining 50 patients were included in the statistical analysis and assigned to the non-dry weight group (N = 21) and the dry weight group (N = 29) (Fig. 1).
Comparison of dry weight and non-dry weight groups
Age, sex, and duration of HD were comparable between the two groups. Dry weight, pre-dialysis weight, post-dialysis weight, and interdialytic weight gain (IDWG)% (pre-dialysis weight - previous post-dialysis weight) were similar between the dry and non-dry weight groups. Ultrafiltration was higher in the dry weight group with a non-significant difference (p=0.075). After dialysis, delta weight (post-dialysis weight - dry weight) was significantly lower in the dry weight group (p <0.001; Table I).
|
Data is presented as mean ± standard deviation, or median (interquartile range) or frequency (%). *Significant with p ≤0.05. HD: hemodialysis Delta weight= post-dialysis weight - dry weight. IDWG (interdialytic weight gain) (%)=(Pre-dialysis weight - dry weight)/dry weight)*100. Delta weight (%): ((Post - dialysis weight – dry weight)/dry weight) *100. |
||||
| Table I. Demographic data, weight, overload percentage pre dialysis and post dialysis of the study groups. | ||||
|
|
|
|
||
| Age (years) |
|
|
|
|
| Sex | Male |
|
|
|
| Female |
|
|
||
| Duration of HD (years) |
|
|
|
|
| Dry weight (kg) |
|
|
|
|
| Pre-dialysis weight (kg) |
|
|
|
|
| Post-dialysis weight (kg) |
|
|
|
|
| Ultrafiltration (kg) |
|
|
|
|
| Delta weight (kg) |
|
|
|
|
| IDWG (%) |
|
|
|
|
| Delta weight (%) |
|
|
|
|
Before dialysis, SBP percentile did not differ significantly. After dialysis, SBP drop was higher in the dry weight group but the difference was not significant (p=0.06). Before or after-dialysis DBP percentiles did not differ significantly between groups (Table II).
|
Data are presented as mean ± standard deviation. TFC: Thoracic fluid content. *Significant with p ≤0.05. |
|||
| Table II. Systolic and diastolic blood pressure, TFC and B-line score of the studied groups | |||
|
|
|
|
|
| Patients using antihypertensive drugs |
|
|
|
| Systolic blood pressure (percentiles) | |||
| Before |
|
|
|
| After |
|
|
|
| Change |
|
|
|
| Diastolic blood pressure (percentiles) | |||
| Before |
|
|
|
| After |
|
|
|
| Change |
|
|
|
| TFC (kOhm-1) | |||
| Before |
|
|
|
| After |
|
|
|
| Change |
|
|
|
| B-line score | |||
| Before |
|
|
|
| After |
|
|
|
| Change |
|
|
|
TFC and B-line scores did not differ significantly before dialysis between the two groups. They were significantly lower after dialysis in the dry weight group than in the non-dry weight group (p < 0.001). TFC and B-line score changes were significantly greater in the dry weight group than in the non-dry weight group (p <0.05; Table II, Fig. 2).
Correlation of after dialysis TFC and B-line scores with clinical parameters
The correlations of post-dialysis TFC and B-line scores with clinical parameters (delta weight and after dialysis SBP percentile) among the 50 patients are given in Table III. TFC and B-line scores were positively correlated with delta weight (%) (r=0.415, p=0.002 and r=0.475, p<0.001; respectively). The B-line score was positively correlated with after dialysis SBP percentile (r = 0.439, p = 0.001), and TFC was also positively correlated with after dialysis SBP percentile (r = 0.286, p = 0.043; Table III).
|
Post-dialysis values for SBP percentile, TFC and B-lines were used for the correlation analysis. *Significant with p ≤0.05. r: Pearson correlation coefficient, SBP: systolic blood pressure, TFC: Thoracic fluid content. |
|||
| Table III. Correlation of post-dialysis TFC and B-line scores with clinical parameters | |||
|
|
|
||
| Delta weight (%) | r |
|
|
| p value |
|
|
|
| SBP percentiles | r |
|
|
| p value |
|
|
|
Diagnostic performance of TFC and B-line scores in predicting hypervolemia
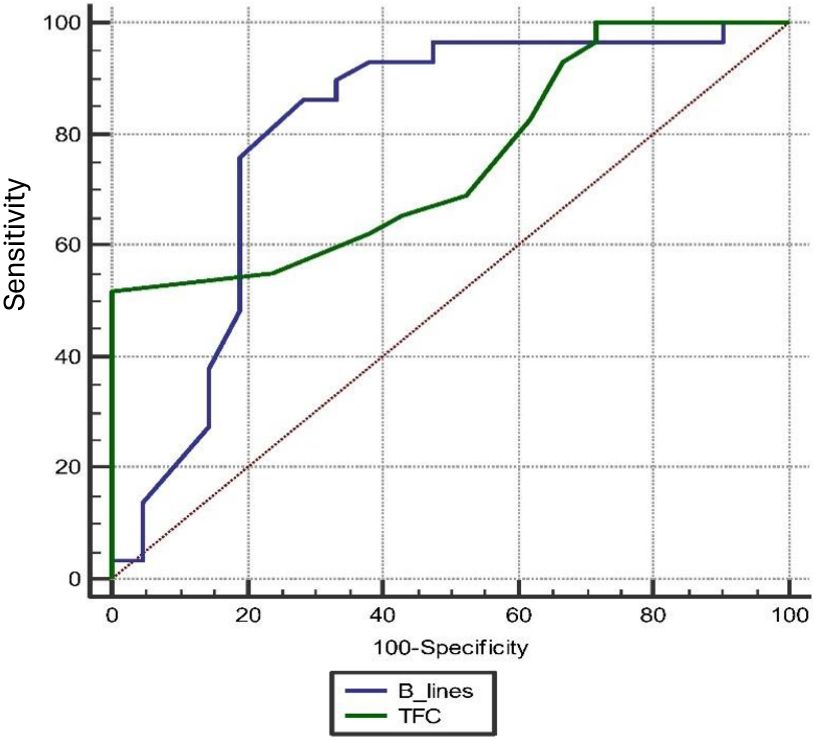
TFC significantly predicted hypervolemia (p <0.001 and area under the curve [AUC] = 0.750) with 76.19% sensitivity, 55.71% specificity, 55.2% positive predictive value (PPV), and 76.2% negative predictive value (NPV) at a cut-off>31 kOhm-1 with a 95% CI of 0.608-0.862. The B-line score significantly predicted hypervolemia (P <0.001 and AUC = 0.801) with 80.95% sensitivity, 75.86% specificity, 70.8% PPV, and 84.6% NPV at a cut-off>17 (95% CI: 0.664-0.901). TFC was comparable to the B-line score in the prediction of hypervolemia (p=0.585, difference between AUCs=0.050, 95% CI: -0.132 to 0.234; Fig. 3).
Discussion
In this cross-sectional study, we assessed the role of different thoracic fluid status measurement methods (the LUS-derived B-lines and EC-derived TFC scores) to evaluate fluid overload in pediatric maintenance HD patients. Both methods were well correlated with clinical parameters of hypervolemia including post-dialysis residual hypervolemia (delta weight) and post-dialysis SBP. The predictive sensitivity and specificity of B-lines were 81% and 76%, whereas for TFC they were 76% and 55%, respectively.
The occurrence of both hypovolemia and hypervolemia can negatively impact quality of life and contribute to the development of chronic cardiovascular disease. Therefore, careful adjustment of the prescribed target weight in children undergoing HD is crucial to minimize the risks of fluid retention.10
Similarly, Paglialonga et al. noted that interdialytic BP fluctuations in pediatric cases undergoing chronic HD showed significant variability. Moreover, BP changes were significantly correlated with corresponding variations in body weight.20
In our study, B-line scores were significantly lower after dialysis in the dry weight group compared to the non-dry weight group, and both modalities showed good predictive ability for detecting hypervolemia, confirming the utility of LUS in assessing fluid status. Our results regarding B-lines are consistent with previous observations. Arthur et al.21 stated that B-line scores were significantly lower after dialysis than before dialysis. The B-line number decreased by 1.69 between the pre-dialysis assessment and the midpoint of the HD session and by 0.58 between the midpoint and the end of the session. Additionally, there was a correlation between fluid loss and B-line reduction, with each 1 mL/kg of fluid loss corresponding to a decline of 0.079 in the initial B-line count. Based on these findings, the researchers concluded that LUS can effectively evaluate fluid volume status, as demonstrated by the correlation between B-line changes and the amount of fluid removed per body weight.
Similarly, Sweed et al.19 found no difference in B-line scores between the two groups (the non-dry and dry weights) before dialysis. However, after dialysis, the dry weight group had significantly lower B-line scores than the non-dry weight group. Additionally, there was a positive correlation between the total number of B-lines before dialysis and interdialytic weight gain, pre-dialytic BP, and clinical fluid score. Weight loss was correlated with the decline in B-line scores.
Additionally, Fu et al.22 stated that the mean B-line scores diminished from before HD to after HD (23.5 vs. 8.5) in the dry Weight group and from before HD to after HD (56.5 vs. 32) in the non-dry weight group.
Our study also demonstrated the clinical value of TFC as an indicator of fluid status. Within our pediatric HD cohort, TFC was significantly lower after HD in those who achieved dry weight compared to the non-dry weight group. This supports the utility of TFC in assessing hypervolemia and monitoring fluid removal.
In line with our findings, Wilken et al.23 studied the effect of HD on EC parameters in pediatric patients with kidney failure on HD. They found that TFC was significantly lower after dialysis than before the dialysis session. They concluded that TFC could be used as an additional parameter to assess the patients’ fluid status. Bioimpedance (comparable to the EC parameter TFC) has been studied with other devices in the HD setting.24,25
However, it is important to note that EC-derived TFC is an indirect measure of thoracic fluid and may be influenced by factors other than net fluid removal. Transcellular fluid shifts, changes in plasma osmolarity, hemoconcentration, electrolyte variations, and redistribution between intravascular, interstitial, and intracellular compartments during HD can alter electrical conductivity and affect TFC readings independently of actual fluid volume. Consequently, TFC values should be interpreted with caution, particularly in pediatric HD patients, whose fluid and electrolyte shifts may be more volatile. Combining EC with other direct or imaging-based assessments may improve accuracy and reduce misclassification of volume status.23
TFC serves as an indicator for both extravascular and intravascular thoracic fluid. Nevertheless, TFC exhibited a strong correlation with the US in estimating EVLW.26 Consequently, a high TFC value may serve as an indirect indicator of hypervolemia. Prior studies in which TFC successfully monitored the hemodynamic impact of diuretics substantiate this hypothesis, as well as its role in assessing thoracic edema in heart failure patients.27 Additionally, TFC has been shown to monitor the patients’ body weight change and the volume of ultrafiltrate extracted during HD.28 TFC and fluid balance during cardiac surgery have exhibited a strong correlation.29
In line with these findings, Yoon et al. found that TFC correlated well with LUS in estimating EVLW in neonates with transient tachypnea, which is characterized by pulmonary edema resulting from delayed resorption and clearance of fetal alveolar fluid.30
Another study conducted by El-Fattah et al. compared the effectiveness of EC-derived TFC and LUS in diagnosing and monitoring transient tachypnea of newborns (TTN) in late preterm and term infants. The researchers demonstrated that both TFC, measured by EC and LUS, offer valuable bedside tools for diagnosing and managing TTN. Furthermore, they found a strong correlation between TFC, the LUS score, and the degree of respiratory distress characterized by EVLW.31
Despite these strengths, EC has limitations. Although EC is considered operator-independent, its accuracy may be affected by factors like skin resistance, electrode placement, and patient movement, which can compromise signal quality. Additionally, TFC measured by EC is an indirect marker of fluid status and does not specifically quantify EVLW. Therefore, TFC values should be interpreted cautiously, particularly in patients with conditions that may influence thoracic conductivity.
Although the ROC analysis revealed that TFC measured by EC and the B-line score assessed via LUS had similar diagnostic performance in detecting hypervolemia (p=0.585), their clinical utility and feasibility in routine practice differ in important ways. Both methods demonstrated moderate to high sensitivity and specificity, suggesting that either can be useful in evaluating fluid status in pediatric HD patients. However, EC offers certain advantages due to its operator-independence, rapid application, and real-time monitoring capabilities. It may be particularly useful in settings where trained sonographers are not readily available or when continuous hemodynamic monitoring is required. Conversely, LUS provides direct visualization of pulmonary congestion but requires operator expertise and may be limited in cases with poor acoustic windows (e.g., obesity, subcutaneous emphysema).
Thus, while EC and LUS are diagnostically comparable, their strengths differ: EC is better suited for automated, bedside monitoring, whereas LUS remains a valuable imaging tool when performed by trained personnel. Integrating both methods, when feasible, may provide complementary data, improving diagnostic confidence and patient management.
One drawback of LUS is its limited specificity for B-lines, which makes it challenging to distinguish between fibrotic B-lines (associated with intralobular or subpleural septal thickening) and edematous B-lines (indicating intralobular or interlobular septal thickening).32 Furthermore, EVLW accumulation caused by respiratory disease or cardiac failure is challenging to distinguish from one another.33 Additionally, cases of morbid obesity, subcutaneous emphysema, pneumectomy, or pleurisy in patients may lead to reduced precision when employing this technique.34 Despite its popularity as a valuable instrument for lung assessment, the requirement for an expert operator restricts the application of LUS. Good inter-observer agreement has been reported for LUS.35 Nevertheless, it continues to be regarded as a subjective and operator-dependent method.
EC can be used to measure EVLW non-invasively.36 By monitoring alterations in TEB throughout the cardiac cycle, it is possible to continuously track the progression of lung edema and the reduction in lung water content as the condition improves. Without radiation exposure, this method can quantify disease severity and treatment response.37
Within the cohort of pediatric HD patients, our study confirmed that TFC was significantly lower after HD in those who achieved dry weight compared to the non-dry weight group, supporting its utility in assessing fluid status and hypervolemia.
The current study was subject to several limitations, including a limited sample size and its completion at a single location, which may hinder the generalizability of the findings. Future research involving larger, multi-center studies with control groups is recommended. Additionally, comparisons with other techniques, such as echocardiography and BIS, would provide valuable insights. While LUS offers direct visualization of pulmonary congestion, it is operator-dependent and may be limited in patients with poor acoustic windows, such as those with obesity or subcutaneous emphysema.
Conclusions
While the predictive strengths of EC and LUS are comparable, EC is not as dependent on operator skills and can detect hypervolemia with similar accuracy. EC is a feasible alternative to LUS for assessing hypervolemia in pediatric HD patients. Given its objectivity and reduced reliance on skilled operators, EC may be a valuable tool in clinical practice, especially in settings where LUS might be challenging to perform.
Ethical approval
The study was approved by Ethical Committee Tanta University Hospitals, Egypt (approval code: 36264PR187/4/23, date: 15/04/2023) and registration of clinicaltrials.gov (ID: NCT05943717).
Source of funding
The authors declare the study received no funding.
Conflict of interest
The authors declare that there is no conflict of interest.
References
- Allinovi M, Saleem M, Romagnani P, Nazerian P, Hayes W. Lung ultrasound: a novel technique for detecting fluid overload in children on dialysis. Nephrol Dial Transplant 2017; 32: 541-547. https://doi.org/10.1093/ndt/gfw037
- Allinovi M, Saleem MA, Burgess O, Armstrong C, Hayes W. Finding covert fluid: methods for detecting volume overload in children on dialysis. Pediatr Nephrol 2016; 31: 2327-2335. https://doi.org/10.1007/s00467-016-3431-4
- Kanbay M, Ertuglu LA, Afsar B, et al. An update review of intradialytic hypotension: concept, risk factors, clinical implications and management. Clin Kidney J 2020; 13: 981-993. https://doi.org/10.1093/ckj/sfaa078
- Davenport A. Why is intradialytic hypotension the commonest complication of outpatient dialysis treatments? Kidney Int Rep 2022; 8: 405-418. https://doi.org/10.1016/j.ekir.2022.10.031
- Kim HR, Bae HJ, Jeon JW, et al. A novel approach to dry weight adjustments for dialysis patients using machine learning. PLoS One 2021; 16: e0250467. https://doi.org/10.1371/journal.pone.0250467
- Canaud B, Chazot C, Koomans J, Collins A. Fluid and hemodynamic management in hemodialysis patients: challenges and opportunities. J Bras Nefrol 2019; 41: 550-559. https://doi.org/10.1590/2175-8239-JBN-2019-0135
- Elgenidy A, Amin MA, Awad AK, et al. The use of lung ultrasound in evaluation of extravascular lung water in hemodialysis patients: systematic review and meta-analysis. Hemodial Int 2024; 28: 148-161. https://doi.org/10.1111/hdi.13141
- Rajpal M, Talwar V, Krishna B, Mustafi SM. Assessment of extravascular lung water using lung ultrasound in critically ill patients admitted to intensive care unit. Indian J Crit Care Med 2024; 28: 165-169. https://doi.org/10.5005/jp-journals-10071-24635
- Li F, Ding M, Wang Y, et al. Association of lung ultrasound B-lines with left ventricular diastolic function in clinically euvolemic haemodialysis patients. Blood Purif 2024; 53: 200-209. https://doi.org/10.1159/000535249
- Mahmoud KH, Mokhtar MS, Soliman RA, Khaled MM. Non invasive adjustment of fluid status in critically ill patients on renal replacement therapy. Role of electrical cardiometry. Egypt J Crit Care Med 2016; 4: 57-65. https://doi.org/10.1016/j.ejccm.2016.06.001
- Van Wyk L, Gupta S, Lawrenson J, de Boode WP. Accuracy and trending ability of electrical biosensing technology for non-invasive cardiac output monitoring in neonates: a systematic qualitative review. Front Pediatr 2022; 10: 851850. https://doi.org/10.3389/fped.2022.851850
- Narula J, Kiran U, Malhotra Kapoor P, Choudhury M, Rajashekar P, Kumar Chowdhary U. Assessment of changes in hemodynamics and intrathoracic fluid using electrical cardiometry during autologous blood harvest. J Cardiothorac Vasc Anesth 2017; 31: 84-89. https://doi.org/10.1053/j.jvca.2016.07.032
- Fathy S, Hasanin AM, Raafat M, et al. Thoracic fluid content: a novel parameter for predicting failed weaning from mechanical ventilation. J Intensive Care 2020; 8: 20. https://doi.org/10.1186/s40560-020-00439-2
- El-Shafie AM, El-Gendy FM, Allhony DM, et al. Establishment of blood pressure nomograms representative for Egyptian children and adolescents: a cross-sectional study. BMJ Open 2018; 8: e020609. https://doi.org/10.1136/bmjopen-2017-020609
- Karava V, Benzouid C, Kwon T, Macher MA, Deschênes G, Hogan J. Interdialytic weight gain and vasculopathy in children on hemodialysis: a single center study. Pediatr Nephrol 2018; 33: 2329-2336. https://doi.org/10.1007/s00467-018-4026-z
- Rabie MM, Al-Gendy MA, Abdelaziz AF. Assessment of volume status in children on regular hemodialysis using N-terminal pro B-type natriuretic peptide. J Egypt Soc Nephrol Transplant 2025; 20: 1-14. https://doi.org/10.21608/geget.2026.481359
- Fadel FI, Salah DM, Mawla MAA, Galal E, Sayed S. Assessment of volume status of pediatric hemodialysis patients. Pediatr Nephrol 2024; 39: 3057-3066. https://doi.org/10.1007/s00467-024-06409-2
- Basso F, Milan Manani S, Cruz DN, et al. Comparison and reproducibility of techniques for fluid status assessment in chronic hemodialysis patients. Cardiorenal Med 2013; 3: 104-112. https://doi.org/10.1159/000351008
- Sweed EM, Shafei AS, Mohamed AA, El-Gendy SA, Afifi WE. Value of lung ultrasound in detection of volume overload in children chronic kidney disease on regular hemodialysis: prospective cohort study. Egypt J Radiol Nucl Med 2023; 54: 186. https://doi.org/10.1186/s43055-023-01128-4
- Paglialonga F, Consolo S, Galli MA, Testa S, Edefonti A. Interdialytic weight gain in oligoanuric children and adolescents on chronic hemodialysis. Pediatr Nephrol 2015; 30: 999-1005. https://doi.org/10.1007/s00467-014-3005-2
- Arthur L, Prodhan P, Blaszak R, Crawford B, Brown CC, Arthur J. Evaluation of lung ultrasound to detect volume overload in children undergoing dialysis. Pediatr Nephrol 2023; 38: 2165-2170. https://doi.org/10.1007/s00467-022-05723-x
- Fu Q, Chen Z, Fan J, et al. Lung ultrasound methods for assessing fluid volume change and monitoring dry weight in pediatric hemodialysis patients. Pediatr Nephrol 2021; 36: 969-976. https://doi.org/10.1007/s00467-020-04735-9
- Wilken M, Oh J, Pinnschmidt HO, Singer D, Blohm ME. Effect of hemodialysis on impedance cardiography (electrical velocimetry) parameters in children. Pediatr Nephrol 2020; 35: 669-676. https://doi.org/10.1007/s00467-019-04409-1
- Czyżewski Ł, Wyzgał J, Czyżewska E, Sańko-Resmer J, Szarpak Ł. Assessment of volumetric hemodynamic parameters and body composition in stable renal transplant recipients. Ann Transplant 2017; 22: 187-198. https://doi.org/10.12659/aot.901515
- Hayes W, Paglialonga F. Assessment and management of fluid overload in children on dialysis. Pediatr Nephrol 2019; 34: 233-242. https://doi.org/10.1007/s00467-018-3916-4
- Hammad Y, Hasanin A, Elsakka A, et al. Thoracic fluid content: a novel parameter for detection of pulmonary edema in parturients with preeclampsia. J Clin Monit Comput 2019; 33: 413-418. https://doi.org/10.1007/s10877-018-0176-6
- Folan L, Funk M. Measurement of thoracic fluid content in heart failure: the role of impedance cardiography. AACN Adv Crit Care 2008; 19: 47-55. https://doi.org/10.1097/01.AACN.0000310751.93287.42
- Kossari N, Hufnagel G, Squara P. Bioreactance: a new tool for cardiac output and thoracic fluid content monitoring during hemodialysis. Hemodial Int 2009; 13: 512-517. https://doi.org/10.1111/j.1542-4758.2009.00386.x
- Perko MJ, Jarnvig IL, Højgaard-Rasmussen N, Eliasen K, Arendrup H. Electric impedance for evaluation of body fluid balance in cardiac surgical patients. J Cardiothorac Vasc Anesth 2001; 15: 44-48. https://doi.org/10.1053/jcan.2001.20272
- Yoon SJ, Han JH, Cho KH, Park J, Lee SM, Park MS. Tools for assessing lung fluid in neonates with respiratory distress. BMC Pediatr 2022; 22: 354. https://doi.org/10.1186/s12887-022-03361-8
- El-Fattah NMA, El-Mahdy HS, Hamisa MF, Ibrahim AM. Thoracic fluid content (TFC) using electrical cardiometry versus lung ultrasound in the diagnosis of transient tachypnea of newborn. Eur J Pediatr 2024; 183: 2597-2603. https://doi.org/10.1007/s00431-024-05507-5
- Picano E, Frassi F, Agricola E, Gligorova S, Gargani L, Mottola G. Ultrasound lung comets: a clinically useful sign of extravascular lung water. J Am Soc Echocardiogr 2006; 19: 356-363. https://doi.org/10.1016/j.echo.2005.05.019
- Picano E, Pellikka PA. Ultrasound of extravascular lung water: a new standard for pulmonary congestion. Eur Heart J 2016; 37: 2097-2104. https://doi.org/10.1093/eurheartj/ehw164
- Neuteboom OB, Heldeweg ML, Pisani L, et al. Assessing extravascular lung water in critically ill patients using lung ultrasound: a systematic review on methodological aspects in diagnostic accuracy studies. Ultrasound Med Biol 2020; 46: 1557-1564. https://doi.org/10.1016/j.ultrasmedbio.2020.02.014
- Zieleskiewicz L, Contargyris C, Brun C, et al. Lung ultrasound predicts interstitial syndrome and hemodynamic profile in parturients with severe preeclampsia. Anesthesiology 2014; 120: 906-914. https://doi.org/10.1097/ALN.0000000000000102
- Gho K, Woo SH, Lee SM, et al. Predictive and prognostic roles of electrical cardiometry in noninvasive assessments of community-acquired pneumonia patients with dyspnoea. Hong Kong J Emerg Med 2021; 28: 205-214. https://doi.org/10.1177/1024907919860643
- Soliman R. Prediction of fluid status and survival by electrical cardiometry in septic patients with acute circulatory failure. Egypt J Crit Care Med 2017; 5: 65-68. https://doi.org/10.1016/j.ejccm.2017.03.001
Copyright and license
Copyright © 2026 The Author(s). This is an open access article distributed under the Creative Commons Attribution License (CC BY), which permits unrestricted use, distribution, and reproduction in any medium or format, provided the original work is properly cited.