A letter to the editor is published about this article:
Abstract
Background. This cross-sectional study aimed to evaluate the dietary adequacy and growth patterns of children considered to have a poor appetite by their mothers and to compare these findings with established reference values.
Methods. A total of 200 volunteer mothers who applied because they thought their children (2-9 years) had poor appetites participated in the study. Maternal reports were obtained through a comprehensive questionnaire, encompassing socio-demographic characteristics, dietary habits, the Children’s Eating Behavior Questionnaire (CEBQ), anthropometric measurements, and three-day food consumption records. Children’s anthropometric measurements were evaluated according to z-scores based on the World Health Organization standards, and daily energy and nutrient intake amounts were determined from food consumption records. Dietary adequacy was calculated according to dietary reference intakes (DRI).
Results. It was found that 90.5% of the children had normal height, and 6.0% were stunted/severely stunted. According to body mass index (BMI)-for-age z-scores (BAZ), 92.5% of the children had normal weight. All mothers perceived that their children had poor appetite, and 55% also believed their children to be underweight, whereas objective measurements indicated that 90% of these children had normal weight. The scores of sub-dimensions of “Food Responsiveness” and “Emotional Overeating” of CEBQ for girls (12.6±2.7 and 9.6±2.3, respectively) were significantly higher than those for boys (11.2±2.8 and 8.7±2.4, respectively) (p<0.05). Regarding dietary adequacy, both boys and girls met their daily energy (91.4±8.5% and 88.3±7.8%, respectively) and protein requirements (196.4±47.7% and 210,3±41,8%, respectively). However, fiber, folate, and potassium intakes were relatively low in both sexes. The mean adequacy ratio (MAR) was significantly higher in boys (145.0±16.0) than girls (140.2±15.7). Nonetheless, the MAR values for both sexes were notably high, suggesting an adequate nutrient intake overall. There was a significant weak positive correlation between children’s daily protein intake and z-scores of weight, height and BMI for age. Similarly, a significant weak positive correlation was observed between calcium and iron intake and BAZ.
Conclusions. This study highlighted divergence between perceived and objective nutritional assessments in this population. Comprehensive evaluation, including anthropometric and dietary data, is needed to accurately characterize children’s status.
Keywords: eating behaviors, body mass index, appetite, dietary adequacy
Introduction
Nutrition plays a fundamental role in the growth and development of individuals, commencing from the earliest stages of life and persisting throughout the lifespan. The consequences of inadequate, excessive, or erroneous energy and nutrient intake manifest as malnutrition, creating a dual burden that significantly impacts the health, physical well-being, and cognitive development of children.1 The family/home environment is an essential determinant of children’s dietary intake and its impact on body weight. Parents have the opportunity to positively influence their children’s body weight and food intake by providing healthy foods at home, giving information about healthy nutrition to their children, and being role models in healthy food choices.2 In numerous countries, the responsibility for ensuring children’s nutritional needs primarily falls upon parents and caregivers, with mothers often bearing the primary responsibility. Mothers’ beliefs and behaviors regarding their children’s dietary habits are shaped by perceptions of their children’s nutritional status. Mothers’ awareness of changes in their child’s nutritional status, which may lead to health concerns, initiates the first step in seeking medical assistance and health care.3
Growth during the toddler (ages 1-3 years) and preschool (ages 3-5) years is slower than in infancy but is steady. This decrease in growth velocity is reflected in reduced appetite. However, young children still require an adequate amount of energy and nutrients to meet their nutritional needs. The eating and health habits established during these early years may influence dietary habits and subsequent health in adulthood. The energy needs of toddlers and preschool-age children reflect their slower growth rate compared to earlier stages.4
The World Health Organization (WHO) defines poor appetite as an eating difficulty, rejecting eating, or excessive selectivity in the presence of appropriate and sufficient nutritional sources, in the presence of an individual providing care for children who do not have an underlying organic pathology.5 Remarkably, a substantial proportion of healthy children, estimated at 20-35%, are brought to healthcare facilities due to concerns related to poor appetite and eating difficulties.6 In some societies, being overweight or having a large body is important, and parents evaluate their children’s growth based on this. Although children receive adequate amounts of energy and nutrients, this may not meet the expectations of their parents.3 Studies show that parents generally adopt controlling feeding practices (i.e., food restriction and eating pressure) in response to concerns regarding their children’s appetite and body weight.2,7 It is reported that more than half of parents misjudge their child’s weight status, which is called ‘parental misperception’.8 Unrealistic parental expectations can give rise to unwarranted feelings of anxiety, while inappropriate threats or punishments may intensify a child’s resistance to eating.9 When children with poor appetite seek medical attention in outpatient settings, evaluating their body weight gain, growth trajectory, and developmental progress is imperative.10 The most crucial indicator of a child’s adequate and balanced nutrition is their growth and development. The adequacy of growth is understood by determining the body weight and height children should have according to their age and gender. It is critical to determine whether the preschool and school age child is adequately nourished, determine at an early stage any deviations from normal, and take necessary precautions.11 This study aimed to assess the dietary adequacy and growth patterns of children considered to have a poor appetite by their mothers and to compare these findings with established reference values.
Materials and Methods
Study design, setting, and participants
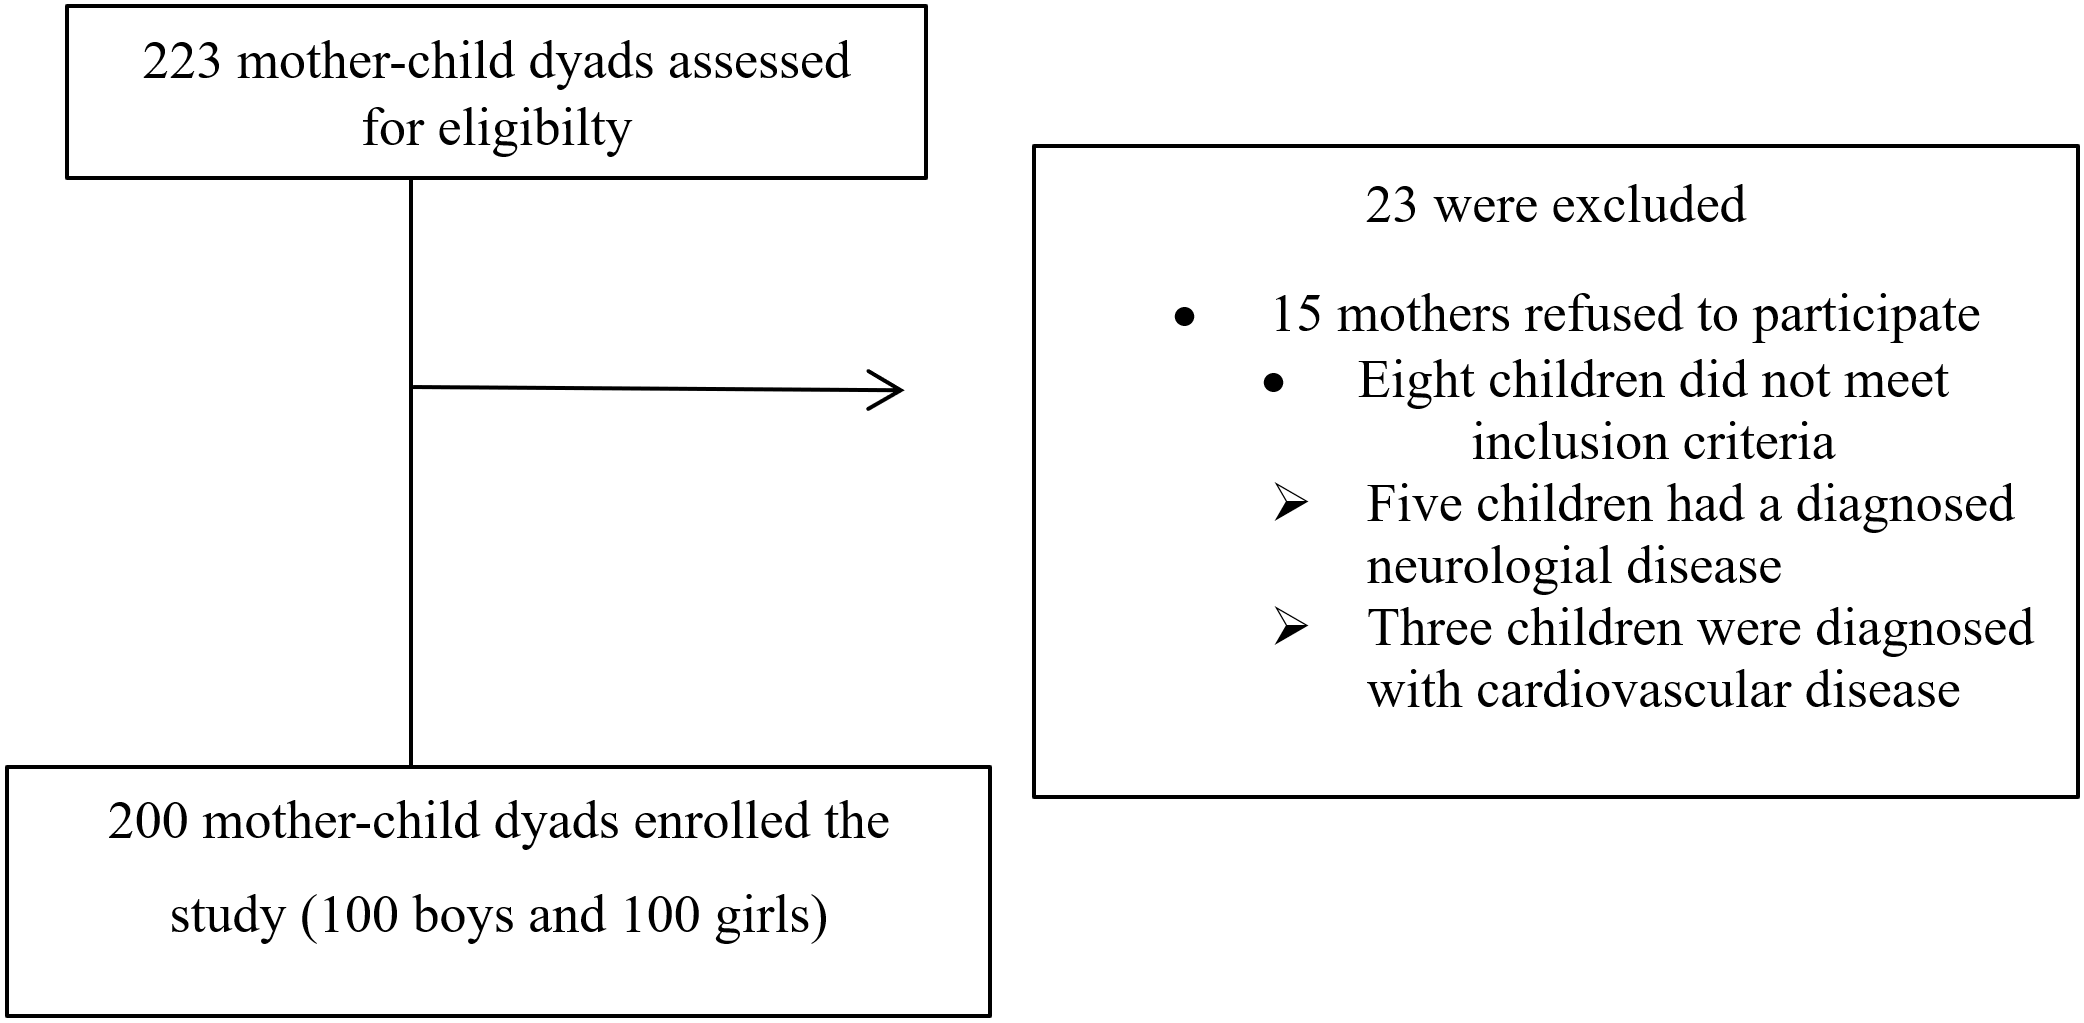
The study was conducted between June 2022 and March 2023 with 200 mother-child dyads aged 2-9 years who applied to the Social Pediatrics Polyclinic because they thought their children had poor appetite. The power analysis, conducted using G*Power version 3.0.10, indicated that a total sample size of at least 199 was necessary to achieve 80% power, with a 5% margin of error, and effect size of d=0.20 with 95% confidence. The study included mothers who thought their child had poor appetite, volunteered to participate, had a child aged between 2 and 9 years, and did not present with communication problems. Encompassed children with chronic, metabolic, or neurological conditions, those accompanied by individuals other than their mothers during clinic visits, those exhibiting abnormal laboratory findings, and those seeking acute care for conditions such as fever, diarrhea, infection, or respiratory distress which are thought to be confounding factors, were determined as exclusion criteria. The flow chart of participants’ enrollment is given in Fig. 1. Informed written consent was obtained from the mothers following the principles outlined in the Declaration of Helsinki, and the study protocol was approved by the Gazi University Ethics Commission (approval number: 2022-537, 22.04.2022).
Data collection and evaluation
Following the completion of their medical examination, the children who had applied to the Social Pediatrics Outpatient Clinic were referred to the dietitian for the study. Data were collected through face-to-face interviews utilizing a comprehensive questionnaire by the same dietitian. The questionnaire, which was developed in line with the literature, comprised sections on children’s socio-demographic characteristics, dietary habits, a 35-item Children’s Eating Behavior Questionnaire (CEBQ), anthropometric measurements, and a three-day food record.3,5
Dietary assessment
Mothers were asked to keep a three-day food record, consisting of one weekend day and two weekdays. The average energy and nutrient values of consumed foods were determined using the Nutrition Information System (BeBiS).12 These values were then evaluated in accordance with the dietary reference intake (DRI) guidelines.13 To evaluate the adequacy of nutrient intake, nutrient adequacy ratios (NARs) were calculated for eleven essential nutrients (protein, fiber, vitamin B6, vitamin B12, vitamin C, folate, calcium, phosphorus, magnesium, iron, and zinc) using the DRI recommendations (%). The mean adequacy ratio (MAR) was obtained by dividing the NARs by the number of nutrients considered.
Children’s Eating Behavior Questionnaire (CEBQ)
The Children’s Eating Behaviour Questionnaire (CEBQ) was utilized to determine the eating behaviors of children. This questionnaire consists of 35 items and employs a 5-point Likert-type scale.14 Eating style is assessed on eight scales: food responsiveness (4 items), enjoyment of food (4 items), emotional overeating (4 items), desire to drink (3 items), satiety responsiveness (5 items), slowness in eating (4 items), and emotional undereating (4 items), and fussiness (7 items). Participants rate the frequency of their child’s behaviors and experiences on a 5-point scale: 1 = never, 2 = rarely, 3 = sometimes, 4 = often, and 5 = always. The questionnaire evaluates both food-approach behaviours and food-avoidant behaviours through these sub-dimensions. Food-approach behaviours include food responsiveness, enjoyment of food, emotional overeating, and desire to drink. Food-avoidant behaviours comprise satiety responsiveness, slowness in eating, emotional undereating, and food fussiness. The internal consistency of the CEBQ was assessed using Cronbach’s alpha coefficients in the original study, ranging from 0.74 to 0.91.14 The CEBQ was adapted for the Turkish population by Yılmaz et al.15 in 2011 with 2–9-year-old children and their parents.
Anthropometric measurements
The body weight and height were obtained by the dietitians and assessed by established reference values. Height was measured (cm) with feet close together and the head in Frankfort plane with a 0.1 cm portable stadiometer. Weight was recorded to the nearest 0.1 kg, using an electronic weighing scale (Seca 285).
The body mass index (BMI, kg/m2), a measure calculated using the body weight and height measurements, was used to evaluate the children’s nutritional status. To assess the growth status, height-for-age Z-score (HAZ), weight-for-age Z-score (WAZ), and BMI-for-age Z-score (BAZ) values were calculated using the World Health Organization (WHO) Anthro/AnthroPlus software.16 The BAZ and HAZ were evaluated based on the WHO Child Growth Standards cut-off values. These Z-scores enable standardized comparison of individual children’s measurements with a reference population. The HAZ value was classified as ‘‘severely stunted’’ (< -3 SD), ‘‘stunted’’ ([-2]–[-3] SD) ‘‘normal’’ ([-2]–[+2] SD), and ‘‘tall’’ (> +2 SD). The BAZ value was classified as “normal” ([-2]-[+2] SD), “underweight” ([-2]-[-3] SD), “severely underweight” (< -3 SD) for children aged 2-5 years17 and “normal” ([-2]-[+1] SD), “underweight” ([-2]-[-3] SD), and”severely underweight” (< -3 SD) for children aged 5-9 years.18
Statistical analysis
Statistical analyses of the study data were performed using SPSS 24.0 (Statistical Package for the Social Sciences, Inc.; Chicago, Illinois, United States). The dependent variables of the study were HAZ and BAZ. Numerical variables were expressed as mean and standard deviation (±SD), and qualitative variables were expressed as number (n) and percentage (%). The Kolmogorov–Smirnov test was conducted to ascertain the normality of the distribution of variables. As the numerical variables between sexes were normally distributed, independent t-test was used to evaluate the difference. Relationships between numerical variables with normal distribution were evaluated with the Pearson correlation coefficient. Statistical significance was evaluated at a p<0.05 level.
Results
Two hundred mother-child dyads participated in the study. The mean age for boys was 4,9±1,9 years, and for girls, it was 5.6±2.0 years. The mean age of the mothers was 32.0±6.3 years (min-max: 18-47 years). Table I shows the distribution of children based on the general characteristics of their families. Of the children, 56.0% were the firstborn in their families. More than half of the mothers (59.0%) and fathers (54.5%) had a high school education or lower. Separation of parents was reported in 16.0% of the families, and 30.0% of the families indicated that their expenses exceeded their income. All mothers perceived that their children had poor appetites, while 55% also perceived that they were underweight. Notably, among the children whose mothers perceived them as underweight, 90% had normal body weight, 8.2% were underweight, and 1.8% were severely underweight. Conversely, only 4.4% of mothers who perceived their children as having a normal body weight had underweight children (Table II).
| Chi-square test. *p<0,05 | |||||||
| Table I. Distribution of children according to the general characteristics of their families and daily activities | |||||||
|
|
|
|
|
||||
|
|
|
|
|
|
|
||
| Birth order | |||||||
| First child |
|
|
|
|
|
|
|
| 2-4 child |
|
|
|
|
|
|
|
| Mother's educational status | |||||||
| High school and below |
|
|
|
|
|
|
|
| University and above |
|
|
|
|
|
|
|
| Father's educational status | |||||||
| High school and below |
|
|
|
|
|
|
|
| University and above |
|
|
|
|
|
|
|
| Mother's working status | |||||||
| Not working |
|
|
|
|
|
|
|
| Working |
|
|
|
|
|
|
|
| Father's occupation | |||||||
| Civil Servant/Worker |
|
|
|
|
|
|
|
| Self-employment |
|
|
|
|
|
|
|
| Family type | |||||||
| Nuclear |
|
|
|
|
|
|
|
| Extended |
|
|
|
|
|
|
|
| Broken |
|
|
|
|
|
|
|
| Family income status | |||||||
| Income is less than expenses |
|
|
|
|
|
|
|
| Income is more than expenses |
|
|
|
|
|
|
|
| Income is equal to expenses |
|
|
|
|
|
|
|
| Parental assessment of child's body weight | |||||||
| Underweight |
|
|
|
|
|
|
|
| Normal |
|
|
|
|
|
|
|
| Free time activities | |||||||
| Outdoor activity |
|
|
|
|
|
|
|
| Sedentary activity |
|
|
|
|
|
|
|
| Outdoor play time | |||||||
| Less than 1 hour |
|
|
|
|
|
|
|
| 1 hour or more |
|
|
|
|
|
|
|
| Average TV viewing time per day | |||||||
| Less than 2 hours |
|
|
|
|
|
|
|
| More than 2 hours |
|
|
|
|
|
|
|
| Average daily computer/tablet usage time | |||||||
| Less than 2 hours |
|
|
|
|
|
|
|
| More than 2 hours |
|
|
|
|
|
|
|
| Regular sports activity | |||||||
| Yes |
|
|
|
|
|
|
|
| No |
|
|
|
|
|
|
|
| Average daily sleep time | |||||||
| Less than 9 hours |
|
|
|
|
|
|
|
| More than 9 hours |
|
|
|
|
|
|
|
| Number of meals per day | |||||||
| 1-2 meals |
|
|
|
|
|
|
|
| 3-4 meals |
|
|
|
|
|
|
|
| 5-6 meals |
|
|
|
|
|
|
|
|
*p<0.05, independent groups t-test, **Tall: > +2 SD, normal: (-2)-(+2) SD, stunted: (-2)-(-3) SD, severely stunted: < -3 SD, BAZ: BMI for age z-score, BMI: body mass index, HAZ: height for age z-score, SD: standard deviation, WAZ: weight for age z-score. |
||||||||||||||||||
| Table II. Evaluation of anthropometric measurements of children | ||||||||||||||||||
|
|
|
|
|
|||||||||||||||
|
|
|
|
|
|
|
|||||||||||||
| Height (cm) |
|
|
|
|
|
|
|
|||||||||||
| Body weight (kg) |
|
|
|
|
|
|
|
|||||||||||
| BMI (kg/m2) |
|
|
|
|
|
|
|
|||||||||||
| WAZ |
|
|
|
|
|
|
|
|||||||||||
| HAZ |
|
|
|
|
|
|
|
|||||||||||
| BAZ |
|
|
|
|
|
|
|
|||||||||||
| n | % | n | % | n | % | |||||||||||||
| HAZ classification** | ||||||||||||||||||
| Tall |
|
|
|
|
|
|
||||||||||||
| Normal |
|
|
|
|
|
|
||||||||||||
| Stunted |
|
|
|
|
|
|
||||||||||||
| Severely stunted |
|
|
|
|
|
|
||||||||||||
| BAZ classification*** | ||||||||||||||||||
| Normal |
|
|
|
|
|
|
||||||||||||
| Underweight |
|
|
|
|
|
|
||||||||||||
| Severely underweight |
|
|
|
|
|
|
||||||||||||
|
|
||||||||||||||||||
| Actual weight of child |
|
|
||||||||||||||||
|
|
|
|
|
|||||||||||||||
| Normal weight |
|
|
|
|
||||||||||||||
| Underweight |
|
|
|
|
||||||||||||||
| Severely underweight |
|
|
|
|
||||||||||||||
When the anthropometric measurements were evaluated for the children, it was revealed that 90.5% had a height within the normal range, while 6% were classified as stunted. Based on BMI z scores, 92.5% of the children had a normal body weight (Table II).
Table III presents the evaluation of CEBQ sub-dimension scores according to sex. The scores for girls (12.6±2.7 and 9.6±2.3, respectively) were significantly higher than those for boys (11.2±2.8 and 8.7±2.4, respectively) in the sub-dimensions of “Food Responsiveness” and “Emotional Overeating” (p=0.001 and p=0.013, respectively). No significant sex differences were found in the scores of other sub-dimensions (p>0.05).
|
*p<0.05, independent groups t-test. CEBQ: Children's Eating Behaviour Questionnaire, SD: standard deviation. |
|||||||
| Table III. Evaluation of scores obtained from the sub-dimensions of the CEBQ according to sex | |||||||
|
|
|
|
|||||
|
|
|
|
|
|
|
|
|
| Food responsiveness |
|
|
|
|
|
|
|
| Emotional overeating |
|
|
|
|
|
|
|
| Enjoyment of food |
|
|
|
|
|
|
|
| Desire to drink |
|
|
|
|
|
|
|
| Satiety responsiveness |
|
|
|
|
|
|
|
| Slowness in eating |
|
|
|
|
|
|
|
| Emotional undereating |
|
|
|
|
|
|
|
| Food fussiness |
|
|
|
|
|
|
|
Table IV provides information on the mean daily energy and nutrient intakes NAR and MAR of children by sex. Both boys (91.4±8.5%) and girls (88.3±7.8%) met the energy requirements specified in the DRI. Additionally, they consumed approximately double the recommended protein intake (196.4±47.7% in boys and 210.3±41.8% in girls). However, both sexes exhibited relatively low intakes of fiber (63.6±15.6% in boys and 62.0±13.3% in girls), folate (75.7±16.7% in boys, 78.9±15.3% in girls), and potassium (55.8±15.9% in boys, 61.2±32.5% in girls). The MAR value, although significantly higher in boys, was found to be relatively high in both sexes (145.0±16.0% in boys and 140.2±15.7% in girls).
|
*Difference between NAR values, **p<0.05, independent groups t-test, ***Difference between MAR values, independent groups t-test. MAR: mean adequacy ratio, MUFA: monounsaturated fatty acids, NAR: nutrient adequacy ratio, PUFA: polyunsaturated fatty acids, SD: standard deviation. |
|||||||
| Table IV. Evaluation of children's mean daily energy and nutrient intakes, NAR, and MAR by sex | |||||||
|
|
|
||||||
|
|
|
|
|
||||
|
|
|
|
|
|
|
|
|
| Energy (kcal) |
|
|
|
|
|
|
|
| Carbohydrate (g) |
|
|
|
|
|
|
|
| Carbohydrate (%) |
|
|
|
|
|
|
|
| Protein (g) |
|
|
|
|
|
|
|
| Protein (%) |
|
|
|
|
|
|
|
| Protein (g/kg) |
|
|
|
|
|
|
|
| Fat (g) |
|
|
|
|
|
|
|
| Fat (%) |
|
|
|
|
|
|
|
| Saturated fatty acids (%) |
|
|
|
|
|
|
|
| MUFA (%) |
|
|
|
|
|
|
|
| PUFA (%) |
|
|
|
|
|
|
|
| Cholesterol (mg) |
|
|
|
|
|
|
|
| Fiber (g) |
|
|
|
|
|
|
|
| Vitamin A (mcg) |
|
|
|
|
|
|
|
| Thiamine (mg) |
|
|
|
|
|
|
|
| Riboflavin (mg) |
|
|
|
|
|
|
|
| Niacin (mg) |
|
|
|
|
|
|
|
| Vitamin B6 (mg) |
|
|
|
|
|
|
|
| Folate (mcg) |
|
|
|
|
|
|
|
| Vitamin B12 (mcg) |
|
|
|
|
|
|
|
| Vitamin C (mg) |
|
|
|
|
|
|
|
| Calcium (mg) |
|
|
|
|
|
|
|
| Potassium (mg) |
|
|
|
|
|
|
|
| Magnesium (mg) |
|
|
|
|
|
|
|
| Phosphorus (mg) |
|
|
|
|
|
|
|
| Iron (mg) |
|
|
|
|
|
|
|
| Zinc (mg) |
|
|
|
|
|
|
|
| MAR |
|
|
|
||||
Results revealed a significant but weak positive correlation between children’s daily protein intake and WAZ, HAZ, and BAZ. Similarly, a significant but weak positive correlation was observed between calcium and iron intake and BAZ. Among the sub-dimensions of the CEBQ, the “Food Responsiveness” sub-dimension exhibited an association with WAZ, HAZ, and BAZ. In addition, a significant weak positive relationship was found between enjoyment of food and emotional undereating and BAZ and between satiety responsiveness and HAZ (p<0.05) (Table V).
|
* p<0.05, Pearson correlation test. BAZ: body mass index for age z-score, CEBQ: Children's Eating Behavior Questionnaire, HAZ: height for age z-score, MAR: mean adequacy ratio, NAR: nutrient adequacy ratio, WAZ: weight for age z-score. |
||||||
| Table V. Evaluation of the relationship between WAZ, HAZ, and BAZ scores, adequacy ratio of nutrient requirements, and CEBQ subscale scores of children | ||||||
|
|
|
|
||||
|
|
|
|
|
|
|
|
| NAR | ||||||
| Energy |
|
|
|
|
|
|
| Protein |
|
|
|
|
|
|
| Fiber |
|
|
|
|
|
|
| Vitamin B6 |
|
|
|
|
|
|
| Folate |
|
|
|
|
|
|
| Vitamin B12 |
|
|
|
|
|
|
| Vitamin C |
|
|
|
|
|
|
| Calcium |
|
|
|
|
|
|
| Potassium |
|
|
|
|
|
|
| Magnesium |
|
|
|
|
|
|
| Phosphorus |
|
|
|
|
|
|
| Iron |
|
|
|
|
|
|
| Zinc |
|
|
|
|
|
|
| MAR |
|
|
|
|
|
|
| CEBQ subscale scores | ||||||
| Food responsiveness |
|
|
|
|
|
|
| Emotional overeating |
|
|
|
|
|
|
| Enjoyment of food |
|
|
|
|
|
|
| Desire to drink |
|
|
|
|
|
|
| Satiety responsiveness |
|
|
|
|
|
|
| Slowness in eating |
|
|
|
|
|
|
| Emotional undereating |
|
|
|
|
|
|
| Food fussiness |
|
|
|
|
|
|
Discussion
This study highlighted a significant divergence between parental perceptions and objective measurements of the nutritional status of children with poor appetite. The findings also underscored the importance of accurately assessing children’s nutritional status through comprehensive methods, including objective measurements and dietary assessments.
Although poor appetite may serve as an indicator of an underlying organic condition resulting in lower than expected body weight or impaired weight gain, the majority of cases involving poor appetite still demonstrate normal growth. In our study, the findings revealed that the majority of children exhibited normal height (90.5%) and BMI (92.5%) for their age. Also, it was determined that the majority of the children were able to meet their energy needs and nearly double their protein requirements. Nutrition is the most important factor affecting growth during childhood.1 Since we excluded confounding factors such as certain diseases (such as endocrine, gastrointestinal, and anemia) that affect growth and development, the effect of appetite on growth was observed.
However, parental expectations regarding their children’s nutrition may not always align with their actual nutrition and growth status, leading to concerns about body weight, appearance, or appetite.19 In this study, it was observed that more than half of the mothers who brought their children to the outpatient clinic due to poor appetite believed their children were underweight, while almost all of these children were found to have normal body weight. Another study focusing on 1-4-year-old children and their caregivers revealed that 4.5% of the children were inaccurately perceived as having a “poor appetite” by their caregivers despite demonstrating a good appetite.20 Yılmaz et al. reported a high prevalence of parental misperceptions regarding their child’s growth, with only 16.7% of mothers and fathers accurately estimating their child’s growth.21 Similarly, Pinasco et al. found that 45.8% of the mothers incorrectly estimated their children’s growth.22 These perceptions of underweight or overweight can be influenced by the social environment, socioeconomic status, and cultural traditions.23 It has been reported that many parents do not consider the body weight of their children to be adequate because they believe that a child with a good appetite and a higher body weight is healthier.3 In this study, we found that more than half of the mothers had high school education or below, and more than half of the children were the firstborn. Baughcum et al. showed that, higher maternal educational levels were associated with more accurate predictions of their children’s body weight status.24 Another study reported that a significant proportion of children with poor appetite (32%) were the eldest child in the family, possibly due to increased attention from parents and the experience gained as parents have more children.3
Each child has their own growth rate, and children may not show the same growth rate in each period. Depending on individual differences in growth rate, appetite may decrease or increase in children.25 Poor appetite is a prevalent symptom in childhood, particularly among children aged 1 to 5 years. It affects approximately 30% of typically developing children and up to 80% of children with growth and developmental issues.26 Children with poor appetites often have limited food intake, leading to deficiencies in essential nutrients such as energy, protein, vitamins, and minerals crucial for their growth and development.5 Despite maternal concerns about their children’s nutritional status, the analysis of children’s food intake in relation to reference values revealed that daily energy and nutrient intakes were generally sufficient, with the exception of fiber, folate, potassium (in both sexes), and vitamin A (in boys). A previous study reported similar daily intakes of energy, macronutrients, and micronutrients among children aged 6 to 60 months, regardless of their mothers’ evaluations of their appetite. However, energy, folate, and calcium intakes were below reference values, while protein, vitamin A, zinc, and magnesium intakes exceeded reference values in children aged 12 to 36 and 37 to 60 months.5 Interestingly, we observed that children consumed nearly all of their recommended daily energy intake requirement and twice the recommended protein intake. Despite maternal perceptions of insufficient energy intake, children can obtain high-energy foods in small portions, and some can meet their energy requirements even with one or two meals per day.3 It is important to note that children possess the capacity to self-regulate their energy intake. While meal intakes may fluctuate throughout the day, the total daily energy intake generally remains consistent among both young children and school-age children.3 Notably, meals with a high protein content have been associated with increased satiety and reduced hunger. Proteins are known to induce satiety, stimulate the secretion of gastrointestinal hormones, and enhance diet-induced thermogenesis.27
In terms of nutritional status, the majority of the children in this study exhibited normal HAZ and had normal BAZ. Consistent with previous research, Kaymaz et al. reported that 65% of school-age children (aged 6-15 years) who were brought to the outpatient clinic due to perceived poor appetite and low weight-for-height, without any underlying organic causes, fell within the normal range based on BMI percentile values.10 Another study demonstrated no significant difference in WAZ and HAZ between children whose appetite was considered good or poor by their mothers, with a predominance of low scores in both groups.5 In our study, we observed that children displaying food cravings, which indicate a healthy appetite, had higher WAZ, HAZ, and BAZ. Conversely, children exhibiting emotional undereating, a sign of reduced appetite, had lower BAZ values.
Furthermore, this study observed significant correlations between WAZ, HAZ, and BAZ, and increased protein adequacy ratio, calcium adequacy ratio, and iron adequacy ratio. Adequate intake of macronutrients and micronutrients during infancy and childhood plays a critical role in promoting growth and preventing failure to thrive.28 Energy requirements per kilogram of body weight are lower for school-age children (5-10 years) compared to toddlers and preschoolers.29 Insufficient energy and protein intake, in particular, can lead to growth delay and loss of muscle and fat mass.28 In this study, the protein adequacy ratio, calcium adequacy ratio, and iron adequacy ratio values of the children were found to be high, and the fact that the majority of them had normal BAZ scores is thought to be a good indicator of this.
Evaluation of dietary adequacies by obtaining 3-day food records from children, evaluation of nutritional behaviors with a validated scale, and the large number of samples despite being a single center experience are the strengths of the study. However, this study also has some limitations. First, only mothers participated, thus there might be less generalization of the findings in terms of parent gender. Second, we did not evaluate maternal nutrition-related knowledge, attitudes, and practices, which could have offered a more comprehensive understanding of maternal perception. In addition, the fact that the anxiety and depression status of the mothers was not evaluated is another limitation. Third, the fact that non-nutritional confounding factors such as genetic predisposition, sleep patterns, and physical activity levels that affect growth and development were not evaluated may also be a limitation.
Conclusion
This study revealed a discordance between maternal perceptions of poor appetite and objective assessments of nutritional status in children. While all mothers reported reduced appetite, quantitative analysis showed adequate daily energy and nutrient intake as well as normal growth parameters in the majority of children. This divergence between subjective parental impression and standardized outcome metrics suggests qualitative evaluations may be influenced foremost by mothers sentiment. It is crucial to provide comprehensive training to individuals involved in childcare, particularly mothers, through a multidisciplinary team comprising a pediatrician, dietitian, psychologist, and child development specialist, to enhance their awareness of normal child growth and development. A detailed discussion with the mother regarding the type and quantity of food provided to the child is essential.
Ethical approval
The study was approved by Gazi University Ethics Committee (date: 22.04.2022, number: 2022-537).
Source of funding
The authors declare the study received no funding.
Conflict of interest
The authors declare that there is no conflict of interest.
References
- Cusick SE, Georgieff MK. The role of nutrition in brain development: the golden opportunity of the “First 1000 Days”. J Pediatr 2016; 175: 16-21. https://doi.org/10.1016/j.jpeds.2016.05.013
- Wang J, Zhu D, Cheng X, et al. Maternal perception of child weight and concern about child overweight mediates the relationship between child weight and feeding practices. Public Health Nutr 2022; 25: 1780-1789. https://doi.org/10.1017/S1368980022000040
- Sarker T, Ahmed S, Rahman S, Chakraborty B. Maternal misperception of under-five children weight status and associated factors: a cross-sectional study. Matern Child Nutr 2024; 20: e13674. https://doi.org/10.1111/mcn.13674
- Lechtenberg E. Toddler and preschooler nutrition. In: Brown JE, editor. Nutrition Through the Life Cycle. 8th ed. USA: Cengage Learning; 2024: 259-260.
- Bayindir Gümüş A, Yardimci H, Koç N, Kara Uzun A. Assessment of the nutritional status of children according to maternal reports: are mothers’ perceptions of their children’s appetite accurate? Arch Pediatr 2020; 27: 442-447. https://doi.org/10.1016/j.arcped.2020.08.011
- Pedroso J, Toral N, Gubert MB. Maternal perception of children’s nutritional status in the Federal District, Brazil. PLoS One 2017; 12: e0176344. https://doi.org/10.1371/journal.pone.0176344
- Francis LA, Hofer SM, Birch LL. Predictors of maternal child-feeding style: maternal and child characteristics. Appetite 2001; 37: 231-243. https://doi.org/10.1006/appe.2001.0427
- Lundahl A, Kidwell KM, Nelson TD. Parental underestimates of child weight: A meta-analysis. Pediatrics 2014; 133: 689-703. https://doi.org/10.1542/peds.2013-2690
- Chatoor I, Ganiban J. Food refusal by infants and young children: diagnosis and treatment. Cogn Behav Pract 2003; 10: 138-146. https://doi.org/10.1016/S1077-7229(03)80022-6
- Kaymaz N, Bulur N, Yıldırım Ş, et al. Poor appetite in school children: is it a false perception of parents? J Pediatr Res 2015; 2: 11-16. https://doi.org/10.4274/jpr.58077
- Saavedra JM, Prentice AM. Nutrition in school-age children: a rationale for revisiting priorities. Nutr Rev 2023; 81: 823-843. https://doi.org/10.1093/nutrit/nuac089
- BeBiS. Nutrition Database Software. The German Food Code and Nutrient Database (BLS II.3, 1999) with additions from UDSA-sr and other sources. İstanbul, Turkey, 2004.
- National Institutes of Health. Office of Dietary Supplements. Nutrient Recommendations: Dietary Reference Intakes (DRI). Available at: https://ods.od.nih.gov/HealthInformation/nutrientrecommendations.aspx
- Wardle J, Guthrie CA, Sanderson S, Rapoport L. Development of the Children’s Eating Behaviour Questionnaire. J Child Psychol Psychiatry 2001; 42: 963-970. https://doi.org/10.1111/1469-7610.00792
- Yılmaz R, Esmeray H, Erkorkmaz Ü. Adaptation study of the Turkish Children’s Eating Behavior Questionnaire. Anadolu Psikiyatri Dergisi 2011; 12: 287-294.
- World Health Organization (WHO). WHO anthro survey analyser and other tools. 2011. Available at: https://www.who.int/tools/child-growth-standards/software (Accessed on May 2, 2024).
- World Health Organisation; Multicentre Growth Reference Study Group. WHO Child Growth Standards. Length, Height for-Age, Weight-for-Age, Weight-for-Length and Body Mass Index-for Age. Methods and Development. 2006. Available online: https://www.who.int/publications/i/item/924154693X (accessed on 24 september 2025).
- World Health Organization (WHO). BMI-for-age (5-19 years). Available at: https://www.who.int/tools/growth-reference-data-for-5to19-years/indicators/bmi-for-age
- Jaballas E, Clark-Ott D, Clasen C, Stolfi A, Urban M. Parents’ perceptions of their children’s weight, eating habits, and physical activities at home and at school. J Pediatr Health Care 2011; 25: 294-301. https://doi.org/10.1016/j.pedhc.2010.05.003
- Benjasuwantep B, Chaithirayanon S, Eiamudomkan M. Feeding problems in healthy young children: prevalence, related factors and feeding practices. Pediatr Rep 2013; 5: 38-42. https://doi.org/10.4081/pr.2013.e10
- Yılmaz R, Oflaz MB. Parental perception on body weight and growth of children with low appetite. Medical Journal of Bakırköy 2009; 5: 11-17.
- Pinasco GC, Sales AB, Santos CVA, et al. Maternal perception of the child’s nutritional status from the perspective of adjusted residual analysis. Journal of Human Growth and Development 2020; 30: 389-397. https://doi.org/10.7322/jhgd.v30.11102
- Jain A, Sherman SN, Chamberlin LA, Carter Y, Powers SW, Whitaker RC. Why don’t low-income mothers worry about their preschoolers being overweight? Pediatrics 2001; 107: 1138-1146. https://doi.org/10.1542/peds.107.5.1138
- Baughcum AE, Chamberlin LA, Deeks CM, Powers SW, Whitaker RC. Maternal perceptions of overweight preschool children. Pediatrics 2000; 106: 1380-1386. https://doi.org/10.1542/peds.106.6.1380
- Şanlıer N, Ejder ZB. Okul öncesi çağ çocuklarında iştahsızlık. In: Vakalarla öğreniyorum: Çocuk hastalıklarında tıbbi beslenme tedavisi-1. Ankara: Nobel Tıp Kitapevleri; 2024: 298-308.
- Gökalp C, Yıldız S, Halıcıoğlu Baltalı O. Eating behaviors in early childhood (1-5 Years) and their association with sociodemographic characteristics in Turkey. Cureus 2021; 13: e16876. https://doi.org/10.7759/cureus.16876
- Bendtsen LQ, Lorenzen JK, Bendsen NT, Rasmussen C, Astrup A. Effect of dairy proteins on appetite, energy expenditure, body weight, and composition: a review of the evidence from controlled clinical trials. Adv Nutr 2013; 4: 418-438. https://doi.org/10.3945/an.113.003723
- Fikawati S, Syafiq A, Ririyanti RK, Gemily SC. Energy and protein intakes are associated with stunting among preschool children in Central Jakarta, Indonesia: a case-control study. Malays J Nutr 2021; 27: 81-91. https://doi.org/10.31246/mjn-2020-0074
- Leonberg BL. Child and preadolescent nutrition. In: Brown JE, editor. Nutrition Through the Life Cycle. 8th ed. USA: Cengage Learning; 2024: 303-304.
Copyright and license
Copyright © 2025 The Author(s). This is an open access article distributed under the Creative Commons Attribution License (CC BY), which permits unrestricted use, distribution, and reproduction in any medium or format, provided the original work is properly cited.