Graphical Abstract
Abstract
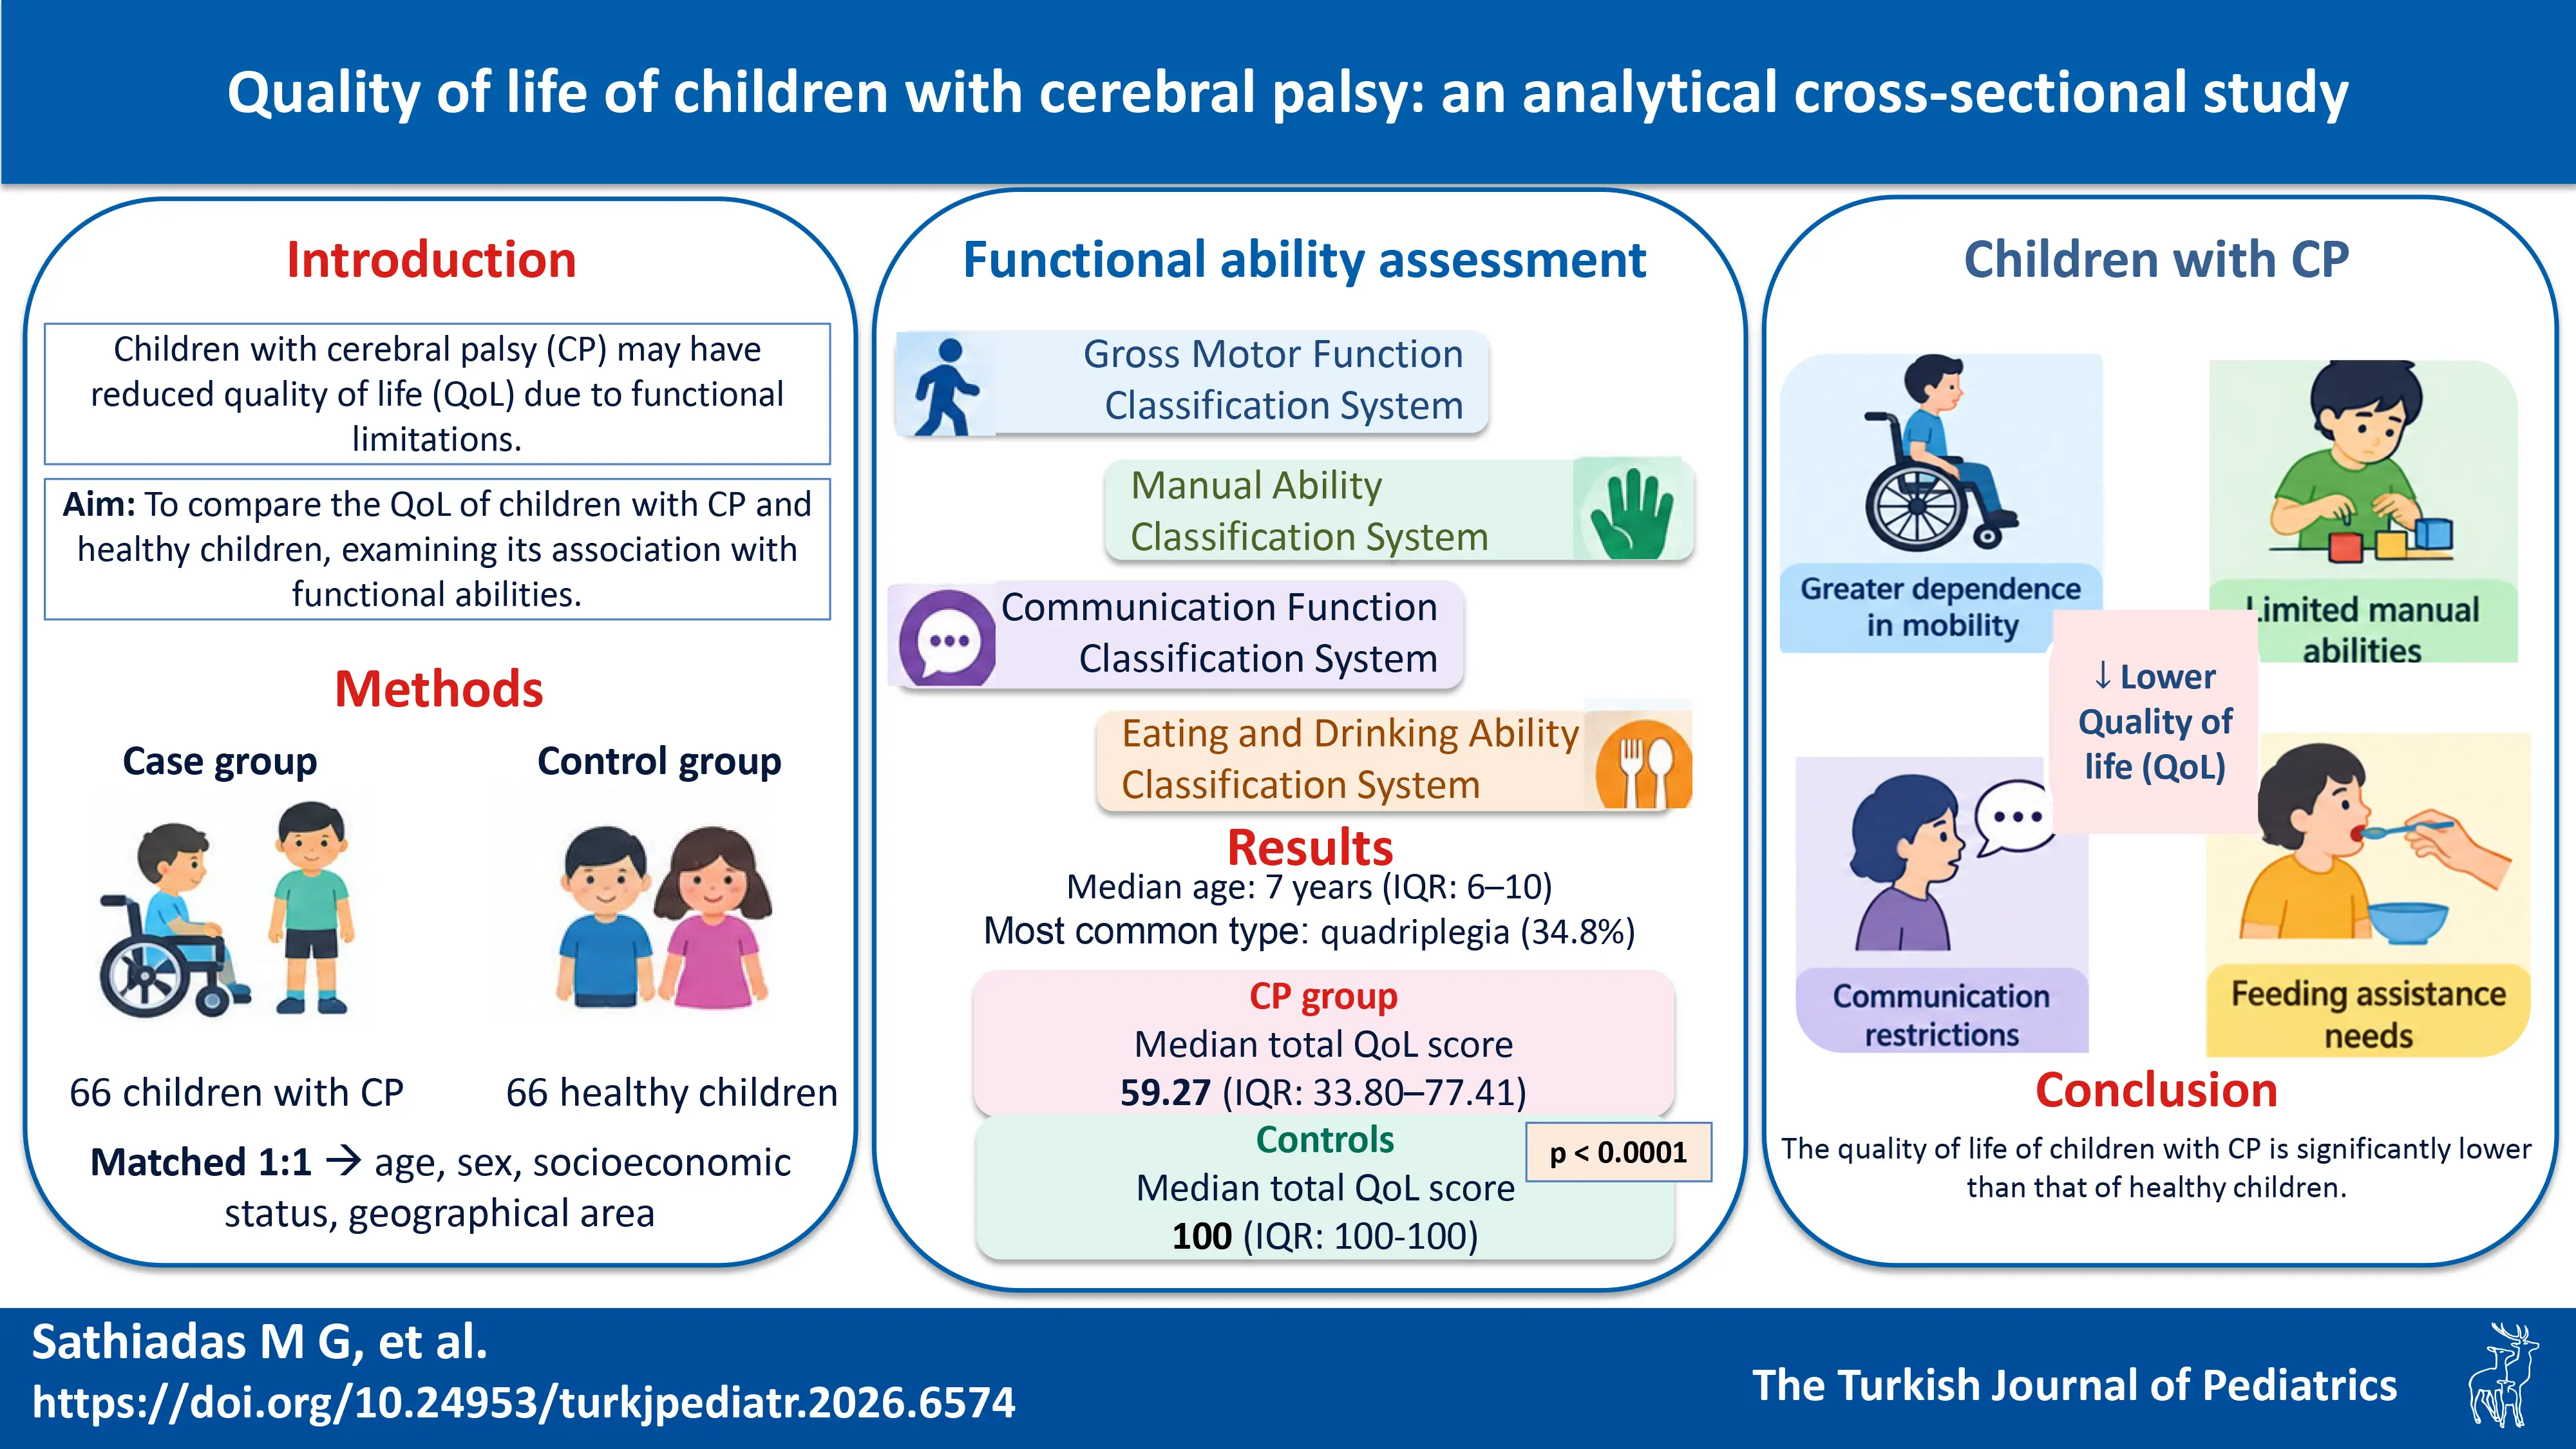
Background. Pediatric quality of life (QoL) reflects a child’s physical, emotional, social, and cognitive well-being within the cultural and family context. Cerebral palsy (CP), the most common childhood motor disability, significantly reduces QoL. This study aims to describe the QoL of children with CP and healthy children, and to examine whether QoL varies according to the functional abilities of children with CP.
Methods. This analytical cross-sectional study was conducted at the Teaching Hospital, Jaffna, Sri Lanka using an investigator-administered questionnaire. Children with CP comprised the case group, and controls were matched in a 1:1 ratio based on age, sex, socioeconomic status, and geographical area. The Gross Motor Function Classification System (GMFCS), Manual Ability Classification System (MACS), Communication Function Classification System (CFCS), and Eating and Drinking Ability Classification System (EDACS) were used to assess functional ability. Quality of life was assessed using the PedsQL™ 3.0 CP Module.
Results. A total of 66 children with CP and 66 age-matched controls were recruited. Both groups had a median age of 7 years (interquiartile range [IQR]: 6-10 years), with the majority (53%) aged 5-7 years. Quadriplegia was the most common type (34.8%) of cerebral palsy. The median total quality of life score was significantly lower among cases than among controls (59.27 [IQR: 33.80-77.41] vs 100 [IQR: 100- 100]; p < 0.0001). Significant differences were observed across all domains between the two groups (p < 0.0001). According to the functional classification systems (GMFCS, MACS, CFCS, and EDACS), children with greater dependence in mobility, more limited manual abilities, greater communication restrictions, and greater feeding assistance needs had significantly lower overall QoL scores compared with their more independent counterparts (p < 0.0001).
Conclusion. The quality of life of children with CP was significantly lower than that of healthy children. Quality of life scores significantly differed across levels of functional ability, with children with greater functional limitations showing poorer outcome.
Keywords: children, cerebral palsy, quality of life
Introduction
Pediatric quality of life (PedsQL) is a multidimensional concept encompassing a child’s physical, emotional, social, and cognitive well-being, as well as the influence of cultural and familial factors.1 According to the World Health Organization (WHO), it reflects a child’s perception of their position in life in the context of their goals, hopes, and concerns.
Cerebral palsy (CP) is widely acknowledged as the leading motor disability in children, affecting approximately 1.2% of children under 5 years of age globally, with over 98% residing in low-and middle- income countries.2 It results from non-progressive brain damage sustained during the prenatal, perinatal, or early postnatal period. According to a population – based study carried out in a rural community in Sri Lanka reported a CP prevalence of 3.7% per, 1000 children aged 2 to 5 years, with 75% having severe impairment.3 To address the lack of comprehensive national data, the Sri Lankan CP registry pilot study was launched to improve documentation.4
CP significantly impacts the quality of life (QoL) by limiting participation in daily activities for both children and their families. Motor functional status and executive functioning are key determinants of QoL, while visual perception, cognition, communication challenges, and parental stress also play key roles.5,6 Children with CP may also face various social and emotional challenges, including social rejection, depression, frustration, anxiety, and anger.7 Compared with typically developing peers, affected children often show scores across domains such as social participation, physical functioning, and general health, alongside difficulties with personal care and reduced activity involvement.8,9 However, self-reported measures may underestimate these challenges due to differing perceptions.9
Caregiver burden significantly impacts parents’ physical and social well-being, autonomy, and financial stability.10 The QoL of parents of children with CP is lower than that of parents of healthy children, with daily activities and physical functioning being particularly affected.11
Assessing QoL in this population is essential for informing clinical care, rehabilitation, and policy planning.12 Condition-specific tools like the CP QoL-Child questionnaire improve assessment accuracy by targeting areas most affected by the disorder.13 Evidence also highlights the benefits of integrating QoL evaluation into routine care to support a holistic, person-centered approach. Notably, active participation in daily routines enhances psychosocial outcomes, especially among ambulatory children, underscoring the importance of promoting engagement through rehabilitation.13
Previous studies assessing QoL in children with CP have predominantly relied on parent-proxy reports, have not included healthy control groups, and often lacked comprehensive functional classification; some included only partial Gross Motor Function Classification System (GMFCS) assessment14,15 while others did not apply any functional classification at all.16,17
Our study aims to incorporate both child self-reports and parent-proxy assessments, compare QoL with that of age-matched healthy controls, and analyze whether functional abilities such as mobility, manual dexterity, communication, and eating and drinking skills are associated with QoL in children with CP.
Materials and methods
Study design and setting
An analytical cross-sectional study was conducted at the Teaching Hospital, Jaffna, Sri Lanka, a tertiary care center serving approximately 232,000 people in Jaffna District, one of the five districts of the Northern Province. The study was carried out over 13 months, from September 2023 to October 2024.
Participants
The study population comprised children diagnosed with CP (cases) and healthy controls who were individually matched for age (± 6 months), sex, geographical location (within a 1 km radius of the index case), and socioeconomic status. Children aged 2 to 16 years with a confirmed diagnosis of CP, characterized by a non- progressive motor disorder affecting movement, balance, and posture were included. The diagnosis was verified by the principal investigator through a review of medical records. Control participants who visited the outpatient department for minor acute self-limiting clinical conditions were recruited from the outpatient department of the same hospital and had no history or clinical evidence of neurological or motor impairment. Children with motor dysfunction due to peripheral causes and without evidence of an insult to the developing brain were excluded from this study.
Variables and measurements
The outcome variable in this study was health-related quality of life (HRQOL), which was assessed using the Pediatric Quality of Life Inventory (PedsQL™) 3.0 CP Module, a validated tool specially designed to evaluate the multidimensional aspects of QoL in children with CP. This instrument includes both child self-report and parent proxy-report versions. The parent-proxy report was used in cases where the child was unable to provide reliable responses due to cognitive or communication limitations.
It contains seven subscales with 35 items: nine on daily activities (self-care tasks such as dressing and toileting), four on school activities (use of school tools such as writing instruments and computers), five on movement and balance (physical mobility and postural control), four on pain and hurt (musculoskeletal pain and sleep interference), four on fatigue (tiredness and low energy), five on eating activities (ability to eat independently), and four on speech and communication (clarity and effectiveness of verbal expression).18
A 5-point Likert scale was employed, with 0 denoting that there was never a problem, 1 denoting that there was seldom a problem, 2 denoting that there was occasionally a problem, 3 denoting that there was frequently a problem, and 4 denoting that there was almost always a problem. Responses were scored in reverse and linearly transformed into a 0 – 100 scale (0=100, 1=75, 2=50, 3=25, 4=0) during data processing. To ensure that higher scores indicated better functioning and less impairment, the total score was calculated as the mean of item responses. The PedsQL™ 3.0 CP Module has demonstrated internal consistency reliabilities that generally exceed the minimum acceptable Cronbach’s alpha coefficient of 0.70.
The primary exposure variable for the case-control comparison was group status (CP vs. healthy children) while for the within-group analysis among children with CP, the exposure variables were the WHO-endorsed functional classification systems: Gross Motor Function Classification System(GMFCS), Manual Ability Classification System (MACS), Communication Function Classification System (CFCS), and Eating and Drinking Ability Classification System (EDACS).19 Each functional classification system categorizes children into five levels (I – V), with Level I representing the highest functional ability and Level V indicating the most severe limitations. For analysis, levels were grouped into two categories based on established definitions.
GMFCS classification
The GMFCS categorizes children based on self-initiated movements, such as sitting, standing, and walking. For analysis, children were grouped into two categories. Those in Levels I – II were classified as having independent mobility, meaning they could walk without limitations or with only minor difficulties. Children in Levels III – V were categorized as having dependent mobility, which includes walking with a handheld device, relying on a wheelchair, or having severely restricted self-mobility even with assistive technology.19
MACS classification
The MACS assesses how children use their hands to handle objects in daily life. Children classified at Levels I – II were described as having better manual ability, indicating that they could manage objects independently or with minimal difficulty. In contrast, those in Levels III – V were considered to have limited manual ability, often requiring assistance, the use of adapted tools, or being unable to manipulate objects effectively.19
CFCS classification
The CFCS evaluates how effectively children communicate with both familiar and unfamiliar individuals. Children in Levels I – II were categorized as having effective communication, meaning they could reliably convey messages across various contexts. Those in Levels III – V were classified as having restricted communication, characterized by inconsistent, unclear, or limited communication that often requires assistance or the use of alternative communication methods.19
EDACS classification
The EDACS classifies children’s safety and efficiency in eating and drinking. Those in Levels I – II were considered to have independent feeding ability, as they were able to eat and drink safely with little or no assistance. Children in Levels III – V were described as having assisted or unsafe feeding, which includes the need for significant help, the use of modified textures, or tube feeding due to safety concerns or inefficiency.19
Data collection
Data were collected by trained personnel using interviewer-administered questionnaires and validated clinical assessment tools during scheduled clinical visits. Demographic and perinatal information was obtained from caregivers and verified against medical and birth records when available. Eligible participants were identified through clinic records and selected based on predefined matching criteria. Interviews were conducted directly with the children when they were able to provide reliable responses; otherwise, interviews were carried out with their primary caregivers. All assessments were performed using standardized procedures to ensure consistency and data reliability across participants.
Sample size
Sample size was calculated based on a 1:1 matched case-control design. Assuming an exposure prevalence of 50% in controls, a correlation coefficient of 0.2 for matched pairs to account for within-pair correlation, a true odds ratio of 3, and 80% power with a 5% significance level, the required sample size was estimated to be 66 cases and 66 matched controls (total n=132).
Data analysis
Data analysis was performed using SPSS version 25. Descriptive statistics were used to summarize participants characteristics. Normality of continuous variables was tested using the Shapiro-Wilk test. As PedsQL™ 3.0 CP Module scores were not normally distributed, non-parametric tests were employed. The Mann-Whitney U test was used to compare QoL scores between cases and controls and across functional subgroups (GMFCS, MACS, CFCS, and EDACS). Results were reported as medians with interquartile ranges (25th – 75th percentile). Missing data were minimal and handled through pairwise deletion. No complex sampling strategies or sensitivity analyses were performed.
Ethical approval
This study was performed in accordance with the principles of the Declaration of Helsinki. The study protocol was approved by the Ethical Review Committee of the Faculty of Medicine, University of Jaffna (J/ERC/23/148/NDR/0301). Written informed consent was obtained from parents or legal guardians, and assent was obtained from children aged 5–16 years.
Results
The study included 132 children, comprising 66 with CP and 66 age- and sex-matched healthy controls. The mean age was 8.14 ± 2.80 years for the cases and 8.14 ± 2.72 years for the controls.
The median age was 7 years (interquartile range [IQR]: 6-10 years) in both groups. In each group, 34 (51.5%) were males, and 32 (48.5%) were female. The male-to-female ratio among participants was 1.1:1.
Table I presents the clinical characteristics of children with CP; the most common type was quadriplegic observed in 23 (34.8%) children, followed by diplegic in 21 (31.8%), hemiplegic in 7 (10.6%) children, athetoid CP in 1 (1.5%) child, and other types in 14 (21.2%), comprising mixed-type CP in 12 (18.2%) and cases that were not clearly classified by subtype in 2 (3.0%). Nearly 38 (57.6%) children used assistive devices. Based on GMFCS levels, 30 (45.5%) had independent mobility, while the remainder required assistance. Regarding manual ability, 42 (63.6%) had better handling skills. Nearly half of the children demonstrated effective communication (n=32, 48.5%), and 49 (74.2%) were independent feeders.
|
*Other types include: 1. Mixed types: Quadriplegic + diplegic: 3 (4.5%), diplegic + triplegic: 1 (1.5%), quadriplegic + hemiplegic: 2 (3.0%), quadriplegic + athetoid: 3 (4.5%), diplegic + hemiplegic: 1 (1.5%), hemiplegic + athetoid: 2 (3.0%) 2. Not clearly diagnosed: 2 (3.0%) CFCS = Communication Function Classification System, CP = cerebral palsy, EDACS = Eating and Drinking Ability Classification System, GMFCS = Gross Motor Function Classification System, MACS = Manual Ability Classification System. |
|
| Table I. Clinical characteristics of children with CP (N=66). | |
|
|
|
| Type of CP | |
| Quadriplegic |
|
| Diplegic |
|
| Hemiplegic |
|
| Athetoid |
|
| Other* |
|
| Use of assistive device | |
| Yes |
|
| No |
|
| GMFCS score | |
| Independent movements (I, II) |
|
| Dependent movements (III, IV, V) |
|
| MACS score | |
| Better handling (I, II) |
|
| More limited handling (III, IV, V) |
|
| CFCS score | |
| Effective communication (I, II) |
|
| Restricted communication (III, IV, V) |
|
| EDACS score | |
| Independent feeders (I, II) |
|
| Assisted feeders (III, IV, V) |
|
Table II highlights the differences between cases and controls. Preterm birth was significantly more common among children with CP (n=16, 22.9%), than among controls (p=0.006). Abnormal newborn examination findings were also significantly more common in the CP group (n=43, 65.2%), than in the control (p<0.0001). The type of questionnaire respondent also differed significantly between groups, with more parent reports in the CP group and more self-reports in controls (p<0.0001). No significant difference was observed in the mode of delivery (p=0.113).
|
Chi-square test. CP = cerebral palsy, LSCS = lower segment Caesarean section. |
|||
| Table II. Comparison of perinatal background and respondents of questionnaire in study groups. | |||
|
|
|
|
|
| Gestational age at birth |
|
||
| Preterm |
|
|
|
| Term |
|
|
|
| Mode of delivery |
|
||
| Normal vaginal delivery |
|
|
|
| Instrument / vacuum |
|
|
|
| Elective / emergency LSCS |
|
|
|
| Detail of newborn examination |
|
||
| Normal |
|
|
|
| Abnormal |
|
|
|
| Reporter |
|
||
| Children |
|
|
|
| Parents |
|
|
|
Table III shows that QoL was significantly lower in children with CP compared with healthy children across all domains assessed by the PedsQL™ 3.0 CP Module. The median total QoL score in cases was 59.27 (33.80-77.41), markedly lower than that of controls, 100 (100-100), with this difference being highly significant (p<0.0001). The domains of daily activities, school functioning, movement and balance, fatigue, eating activities, and speech and communication showed significantly lower scores in cases than in controls (p < 0.0001). Although both groups reported high scores in the pain and hurt domain, the CP group still had a significantly lower scores (median: 100, IQR: 75 – 100) compared with controls (median: 100, IQR: 100 – 100) (p < 0.0001).
| Mann-Whitney U test. Data presented as median (interquartile range). CP: cerebral palsy, QoL: quality of life. |
||||
| Table III. Quality of life scores in children with CP vs. controls. | ||||
| PedsQL 3.0TM CP Module |
|
|
|
|
| Daily Activities |
|
|
|
|
| School Activities |
|
|
|
|
| Movements and Balance |
|
|
|
|
| Pain and Hurt |
|
|
|
|
| Fatigue |
|
|
|
|
| Eating activities |
|
|
|
|
| Speech and Communication |
|
|
|
|
| Total QoL |
|
|
|
|
Table IV shows that children with lower functional abilities had significantly lower QoL scores across multiple domains. For example, those with dependent mobility had a lower median daily activities score of 0.00 (0.00 – 25.00) compared with 66.66 (46.52-86.81) in those with independent mobility (p <0.0001). Similarly, school activities were markedly lower in children with limited handling ability (median: 0.00, IQR: 0.00 – 15.63), compared to those with better handling ability (median: 75.00, IQR: 43.75 – 95.31) (p< 0.0001). Speech and communication scores were also significantly lower in children with restricted communication, , compared to those with effective communication, (median: 9.38, IQR: 0.00 – 31.25 vs. median: 96.88, IQR: 75.00-100.00; p<0.0001). Overall QoL scores were also significantly reduced in all lower-functioning subgroups (p < 0.0001). In contrast, the pain and hurt domain did not show statistically significant differences across any functional classification (p > 0.05).
|
Mann–Whitney U test. Data presented as median (interquartile range). GMFCS I–II = Independent movements; GMFCS III–V = Dependent movements. MACS I–II = Better handling; MACS III–V = More limited handling. CFCS I–II = Effective communication; CFCS III–V = Restricted communication. EDACS I–II = Independent feeding; EDACS III–V = Assisted feeding. CFCS = Communication Function Classification System, CP = cerebral palsy, EDACS = Eating and Drinking Ability Classification System, GMFCS = Gross Motor Function Classification System, MACS = Manual Ability Classification System, QoL = quality of life. |
||||||||
| Table IV. Quality of life by functional classification systems in children with CP. | ||||||||
| Functional classification |
|
|
|
|
|
|
|
|
| Dependent movements |
(0.00-25.00) |
(0.00-75.00) |
(15.00-55.00) |
(71.87-100) |
(0.00-75.00) |
(0.00-78.75) |
(0.00-87.5) |
(9.37-61.07) |
| Independent movements |
(46.52-86.81) |
(35.94-84.38) |
(73.75-100.00) |
(75.00-100.00) |
(50.00-100.00) |
(50.0-100.0) |
(31.25-100.00) |
(61.80-86.05) |
| P |
|
|
|
|
|
|
|
|
| More limited handling |
(0.00-0.00) |
(0.00-15.63) |
(0.00-48.75) |
(18.75-100) |
(0.00-75.00) |
(0.00-40.00) |
(0.00-28.13) |
(0.63-38.57) |
| Better handling |
(31.25-76.39) |
(43.75-95.31) |
(53.75-100.00) |
(75.00-100) |
(54.69-100.00) |
(55.00-100.00) |
(37.50-100.00) |
(61.25-85.26) |
| P |
|
|
|
|
|
|
|
|
| Restricted communication |
(0.00-27.78) |
(0.00-45.31) |
(11.25-76.25) |
(75.00-100) |
(0.00-75.00) |
(0.00-50.00) |
(0.00-31.25) |
(6.30-60.18) |
| Effective communication |
(34.03-79.17) |
(50.00-100.00) |
(45.00-93.75) |
(75.00-100.00 |
(68.75-100) |
(60.00-100.00) |
(75.00-100.00) |
(34.03-79.17) |
| P |
|
|
|
|
|
|
|
|
| Assisted feeding |
(0.00-0.00) |
(0.00-0.00) |
(0.00-42.50) |
(0.00-96.88) |
(0.00-53.13) |
(0.00-12.50) |
(0.00-15.63) |
(0.00-20.83) |
| Independent feeding |
(23.61-72.22) |
(31.25-81.25) |
(47.50-95.00) |
(75.00-100.00) |
(53.13-96.88) |
(50.00-100.00) |
(34.38-100.00) |
(54.91-84.07) |
| P |
|
|
|
|
|
|
|
|
Discussion
This study aimed to evaluate the QoL of children with CP compared with that of age-matched typically developing peers. The findings revealed significantly lower QoL scores across all domains for children with CP, underscoring the profound impact of the condition on various aspects of daily functioning. These findings are consistent with previous studies that have consistently shown that children with CP report lower QoL compared to healthy controls.18,20,21 Similarly, a study from Türkiye found that children with CP have lower participation in out-of-school activities and reduced QoL compared to typically developing peers and that children with limited participation often show a strong preference for such activities, highlighting a gap between desire and opportunity.8 The median total QoL score was 59.27 in children with CP, which aligns with previous studies conducted in Pakistan, India, and South Africa.14,15,17 In Indonesia, using the same PedsQL™ 3.0 CP Module, 76.9% of participants had impaired or poor QoL.16 In our study all 6 domains were affected, whereas the pain and hurt domain showed relatively high scores. This finding contrasts with several previous studies that reported consistently lower pain-related QoL scores among children with CP, suggesting that pain is a common and impactful symptom.21 A possible explanation for our differing result may be the way parents or caregivers interpreted pain. Recognizing pain in children may have been difficult in some cases.
Children with CP who had dependent mobility demonstrated significantly lower median QoL scores across all domains compared to those with independent mobility, a finding that has also been reported in other studies.7,22 As the GMFCS level increases, it not only impacts the child’s functional abilities but also significantly contributes to a higher burden on caregivers. Caregivers of children with more severe motor impairments experience moderate to high levels of burden, with both GMFCS level and number of children being significant predictors.10,23 Regarding mobility devices our study found that only half of the children with CP had access to mobility devices, while the remainder did not. These play a crucial role in enhancing the QoL and development of children with CP. These devices can improve independence and social participation across various settings.24
As measured by the MACS classification, children with CP who had more limited manual handling abilities reported significantly lower QoL scores across multiple domains, particularly daily activities, school activities, eating, and speech and communication. A similar finding has been reported, with manual ability showing a strong correlation with HRQOL measures.25 Several factors may contribute to poorer manual ability in children with CP, including the severity of fine motor impairment, the presence of spasticity or contractures, associated conditions such as cognitive disability and access to follow-up rehabilitation.26
According to the CFCS, our study found that the greatest QoL difference was seen in the speech and communication domain, with lower scores among children with restricted communication. This finding is consistent with an Indian study reporting that functional levels, including communication abilities, are significantly associated with QoL in young children with CP.27 Intellectual functioning and manual ability have been shown to significantly influence communication function in children with CP.28
Based on the EDACS classification, children with CP who required assistance with feeding had significantly lower QoL scores compared with independent feeders. Eating activities and speech and communication showed the largest differences between groups. Similarly, an Indian study found that EDACS, along with other classification system, was an independent predictor of QoL impairment in young children with CP.27 EDACS levels are strongly associated with dietary intake, with children at higher GMFCS levels showing lower energy and nutrient intake compared with those with less severe impairments.29
Although no significant difference was found in the pain and hurt domain between cases and controls, this result may not accurately reflect the true experience of pain in children with CP. A large proportion of responses in the CP group were completed by parents through interviews rather than the children themselves, which may have led to underreporting particularly by children with limited communication abilities. This highlights the potential overestimation of well-being in this domain and underscores the need for future studies to incorporate observational and behavioral pain assessment tools. Such approaches are especially important when evaluating children with communication difficulties to ensure a more accurate understanding of their pain experiences.
The study was conducted with a limited sample size and at a single center. Therefore, the generalizability of the findings may be limited. Quality of life depends on several other factors such as seizures and cognitive impairment, which were not investigated in this study. Preterm birth was significantly more common in children with CP than in controls (p=0.006), indicating a potential baseline confounder. Parent-proxy reporting was also more frequent in the CP group (p<0.0001), which may have introduced reporting bias.
This study highlights the significant impact of CP on the QoL in affected children, as compared to their typically developing peers. Using the PedsQL™ 3.0 CP Module, children with CP demonstrated markedly lower QoL scores across all domains, with the greatest impairments observed in daily activities, school functioning, speech and communications, and eating and drinking abilities. Overall, the results emphasize the importance of comprehensive, multidimensional assessments when evaluating QoL in children with CP. Tailored interventions that address functional limitation and communication challenges are essential to enhance participation and well-being in this vulnerable population.
Ethical approval
The study was approved by the Ethical Review Committee of the University of Jaffna (date :27.09.2023, number: J/ERC/23/148/NDR/031).
Source of funding
The authors declare the study received no funding.
Conflict of interest
The authors declare that there is no conflict of interest.
References
- Haverman L, Limperg PF, Young NL, Grootenhuis MA, Klaassen RJ. Paediatric health-related quality of life: what is it and why should we measure it? Arch Dis Child 2017; 102: 393-400. https://doi.org/10.1136/archdischild-2015-310068
- Olusanya BO, Gladstone M, Wright SM, et al. Cerebral palsy and developmental intellectual disability in children younger than 5 years: findings from the GBD-WHO Rehabilitation Database 2019. Front Public Health 2022; 10: 894546. https://doi.org/10.3389/fpubh.2022.894546
- Wanigasinghe J, Jasotharan V, Thilaxshan T, Murugupillai R, Arambepola C. Prevalence of cerebral palsy among children aged 2 to 5 years in a rural district in Sri Lanka: a population-based study. J Pediatr Neurol 2023; 22: 202-207. https://doi.org/10.1055/s-0043-1770053
- Heiyanthuduwage TM, Sumanasena SP, Kitnasamy G, et al. Protocol for the Sri Lankan Cerebral Palsy Register pilot study. BMJ Open 2020; 10: e039353. https://doi.org/10.1136/bmjopen-2020-039353
- Blasco M, García-Galant M, Laporta-Hoyos O, et al. Factors related to quality of life in children with cerebral palsy. Pediatr Neurol 2023; 141: 101-108. https://doi.org/10.1016/j.pediatrneurol.2023.01.006
- Chen KL, Tseng MH, Shieh JY, Lu L, Huang CY. Determinants of quality of life in children with cerebral palsy: a comprehensive biopsychosocial approach. Res Dev Disabil 2014; 35: 520-528. https://doi.org/10.1016/j.ridd.2013.12.002
- Puspitasari M, Rusmil K, Gurnida D. The relationship between gross motor function and quality of life among children with cerebral palsy. Disabil CBR Incl Dev 2014; 24: 57.
- Bumin G, Akyalcin S, Gurlek S, Akyurek G. Comparison of participation in out-of-school activities, activity preferences and quality of life of children with cerebral palsy and typical development. Dev Neurorehabil 2024; 27: 289-297. https://doi.org/10.1080/17518423.2024.2410173
- Bjornson KF, Belza B, Kartin D, Logsdon RG, McLaughlin J. Self-reported health status and quality of life in youth with cerebral palsy and typically developing youth. Arch Phys Med Rehabil 2008; 89: 121-127. https://doi.org/10.1016/j.apmr.2007.09.016
- Hewawitharana BDR, Wijesinghe CJ, De Silva A, Phillips JP, Hewawitharana GP. Disability and caregiver burden: unique challenges in a developing country. J Pediatr Rehabil Med 2023; 16: 483-491. https://doi.org/10.3233/PRM-220070
- Kołtuniuk A, Rozensztrauch A, Budzińska P, Rosińczuk J. the quality of life of polish children with cerebral palsy and the impact of the disease on the family functioning. J Pediatr Nurs 2019; 47: e75-e82. https://doi.org/10.1016/j.pedn.2019.05.011
- Gilson KM, Davis E, Reddihough D, Graham K, Waters E. Quality of life in children with cerebral palsy: implications for practice. J Child Neurol 2014; 29: 1134-1140. https://doi.org/10.1177/0883073814535502
- Omura J, Fuentes M, Bjornson K. Participation in daily life: influence on quality of life in ambulatory children with cerebral palsy. PM R 2018; 10: 1185-1191. https://doi.org/10.1016/j.pmrj.2018.05.010
- Marques FJP, Carvalho ALD, Borigato EVM, et al. Health-related quality of life in children with cerebral palsy associated with congenital Zika infection. Rev Paul Pediatr 2023; 41: e2022016. https://doi.org/10.1590/1984-0462/2023/41/2022016
- Saikia D, Pradhan MR. Quality of life of children with cerebral palsy: evidence from Assam, India. Clin Epidemiol Glob Health 2024; 28: 101686. https://doi.org/10.1016/j.cegh.2024.101686
- Izzah AN, Irwanto I, Andriati A, Gunawan PI. Assessment quality of life in children with cerebral palsy, ages 2-18 years. Jurnal Berkala Epidemiologi 2021; 9: 166-174. https://doi.org/10.20473/jbe.V9I22021.166-174
- Hanif S, Zameer A, Waheed H, Zaidi F, Ahmed I, Choudary M. Quality of life in children with cerebral palsy: QoL in children with cerebral palsy. Pak J Health Sci 2023; 70-74. https://doi.org/10.54393/pjhs.v4i09.1042
- Varni JW, Burwinkle TM, Berrin SJ, et al. The PedsQL in pediatric cerebral palsy: reliability, validity, and sensitivity of the Generic Core Scales and Cerebral Palsy Module. Dev Med Child Neurol 2007; 48: 442-449. https://doi.org/10.1111/j.1469-8749.2006.tb01293.x
- Paulson A, Vargus-Adams J. Overview of four functional classification systems commonly used in cerebral palsy. Children (Basel) 2017; 4: 30. https://doi.org/10.3390/children4040030
- Soyupek F, Aktepe E, Savas S, Askin A. Do the self-concept and quality of life decrease in CP patients? Focussing on the predictors of self-concept and quality of life. Disabil Rehabil 2010; 32: 1109-1115. https://doi.org/10.3109/09638280903391120
- Power R, King C, Muhit M, et al. Health-related quality of life of children and adolescents with cerebral palsy in low- and middle-income countries: a systematic review. Dev Med Child Neurol 2018; 60: 469-479. https://doi.org/10.1111/dmcn.13681
- Ko J, Lee BH, Kim M. Relationship between function and health-related quality of life of school-aged children with cerebral palsy. J Phys Ther Sci 2011; 23: 189-195. https://doi.org/10.1589/jpts.23.189
- Glinac A, Matović L, Delalić A, Mešalić L. Quality of life in mothers of children with cerebral palsy. Acta Clin Croat 2017; 56: 299-307. https://doi.org/10.20471/acc.2017.56.02.14
- Gudjonsdottir B, Gudmundsdottir SB. Mobility devices for children with physical disabilities: use, satisfaction and impact on participation. Disabil Rehabil Assist Technol 2023; 18: 722-729. https://doi.org/10.1080/17483107.2021.1913519
- Park EY. Relationship between activity limitation and health-related quality of life in school-aged children with cerebral palsy: a cross-sectional study. Health Qual Life Outcomes 2017; 15: 87. https://doi.org/10.1186/s12955-017-0650-8
- Invencao Cabral T, Pan X, Tripathi T, Ma J, Heathcock JC. Manual abilities and cognition in children with cerebral palsy: do fine motor skills impact cognition as measured by the Bayley scales of infant development? Behav Sci (Basel) 2023; 13: 542. https://doi.org/10.3390/bs13070542
- Sharawat IK, Panda PK. Quality of life and its association with level of functioning in young children with cerebral palsy. Neuropediatrics 2022; 53: 227-234. https://doi.org/10.1055/s-0042-1743432
- Choi JY, Park J, Choi YS, Goh YR, Park ES. Functional communication profiles in children with cerebral palsy in relation to gross motor function and manual and intellectual ability. Yonsei Med J 2018; 59: 677-685. https://doi.org/10.3349/ymj.2018.59.5.677
- Sözlü S, Elbasan B, Karabudak E. The relationship between motor levels of children with cerebral palsy and their eating and drinking skills and dietary intakes. Acıbadem University Health Sciences Journal 2022; 13: 607-614. https://doi.org/10.31067/acusaglik.1052677
Copyright and license
Copyright © 2026 The Author(s). This is an open access article distributed under the Creative Commons Attribution License (CC BY), which permits unrestricted use, distribution, and reproduction in any medium or format, provided the original work is properly cited.