Abstract
Background. Influenza remains a major cause of morbidity and mortality in children worldwide, yet vaccination coverage is still suboptimal in many countries. We aimed to understand parental awareness, attitudes, and determinants of vaccine uptake to guide effective strategies for increasing coverage and protecting vulnerable pediatric populations.
Method. A cross-sectional study was conducted between October 2023 and May 2024 in 38 hospitals across 23 provinces in Türkiye. Data were collected from 5002 families through face-to-face interviews, with 4404 valid responses analyzed.
Results. The overall influenza vaccination rate among children was 4.4% (n=195/4404). Vaccination coverage was slightly higher in high-risk groups compared to non-high-risk groups (5.2% vs. 3.5%, p=0.003). Factors positively associated with vaccination uptake included the presence of chronic illness in the child (15.1% in vaccinated vs. 4.7% in unvaccinated, p<0.001), higher parental education levels, and parental history of influenza vaccination (42.8% vs. 4.4%, p<0.001). Logistic regression identified poor attendance at routine pediatric check-ups, lack of awareness of influenza vaccination, and absence of private vaccination as the strongest predictors of non-vaccination.
Conclusion. Parental education and physician recommendation are the strongest determinants of childhood influenza vaccination. Embedding vaccination counseling into routine pediatric visits and implementing awareness strategies may help improve uptake, particularly in high-risk children.
Keywords: children, influenza, vaccination
Introduction
Influenza is an acute respiratory viral infection caused by influenza viruses. Globally, annual seasonal influenza epidemics are estimated to result in approximately 1 billion clinical cases, 3-5 million cases of severe illness, and 290,000-650,000 deaths.1,2 While influenza viruses can infect individuals across all age groups, children experience the highest infection rates.3 The impact of seasonal influenza epidemics in low- and middle-income countries (LMICs) remains poorly understood. However, studies indicate that 99% of deaths due to influenza-associated lower respiratory tract infections in children under five occur in LMICs.4
Seasonal influenza vaccination is widely regarded as one of the most effective measures to prevent influenza and its associated complications.4-6 The World Health Organization (WHO) recommends prioritizing children for influenza vaccination.7 More than 40% of countries incorporate free seasonal influenza vaccination into their National Immunization Schedules, particularly in North and South America, Europe, and certain regions of Africa, Southeast Asia, and the Western Pacific.8-12 Evidence suggests that seasonal influenza vaccination not only protects vaccinated individuals but also reduces influenza incidence in the general population.13 Data from high- and middle-income countries highlight that vaccinating children, particularly school-aged children, yields the greatest impact on community transmission.14,15 However, according to WHO data, Türkiye reported no data on influenza vaccine coverage rates in children for 2015 and 2017.16,17 Despite WHO recommendations, the successful implementation of seasonal influenza vaccination programs for children faces significant challenges, leading to persistently low vaccination rates.
Vaccine hesitancy, recognized as a critical barrier in childhood vaccination programs, was identified by the WHO in 2019 as one of the ten threats to global health. Since parents are the primary decision-makers regarding their children’s healthcare, their attitudes and perceptions significantly influence vaccination decisions. Vaccine hesitancy is often driven by complex factors, including complacency, difficulties in vaccine access, and a lack of trust, as noted by a WHO-affiliated advisory group.18
This study aims to assess influenza vaccination rates and identify factors influencing vaccination uptake among pediatric patients in Türkiye, where influenza immunization is not included in the routine immunization schedule. The findings are expected to provide valuable insights to inform the development of effective influenza vaccination policies.
Materials and Methods
Study design and data source
This study was conducted across 38 hospitals in 23 provinces, representing various geographical regions of Türkiye. All pediatric infectious disease specialists in Türkiye were contacted and invited to participate, and the study was carried out in the centers where specialists accepted the invitation. Particular attention was given to ensuring representation from all seven geographical regions of the country. Data collection took place between October 1, 2023, and May 1, 2024, through face-to-face interviews with families of pediatric patients under 18 years of age. The questionnaire was administered by doctors, and responses from 5,002 participants who sufficiently completed the survey were included in the analysis. Ethical approval for the study was obtained from the Hacettepe University Faculty of Medicine Non-Interventional Clinical Research Ethics Committee (Approval No: 2024/08-66).
The survey gathered data on influenza vaccination status, factors influencing vaccination, and demographic characteristics. The demographic section included variables such as the patient’s age, gender, ethnicity, parents’ age, occupation, education level, monthly income, number of children, the decision-maker regarding the child’s healthcare, place of residence, number of household members, housing conditions (e.g., number of rooms), and prior visits to the same hospital or physician.
The questionnaire also included multiple-choice items regarding patients’ medical history (e.g., underlying diseases), flu vaccination status and history, adherence to routine vaccination schedules, special vaccinations, and parents’ flu vaccination status. Parents were queried about prior awareness of influenza vaccination, as well as their attitudes toward and perceptions of vaccination.
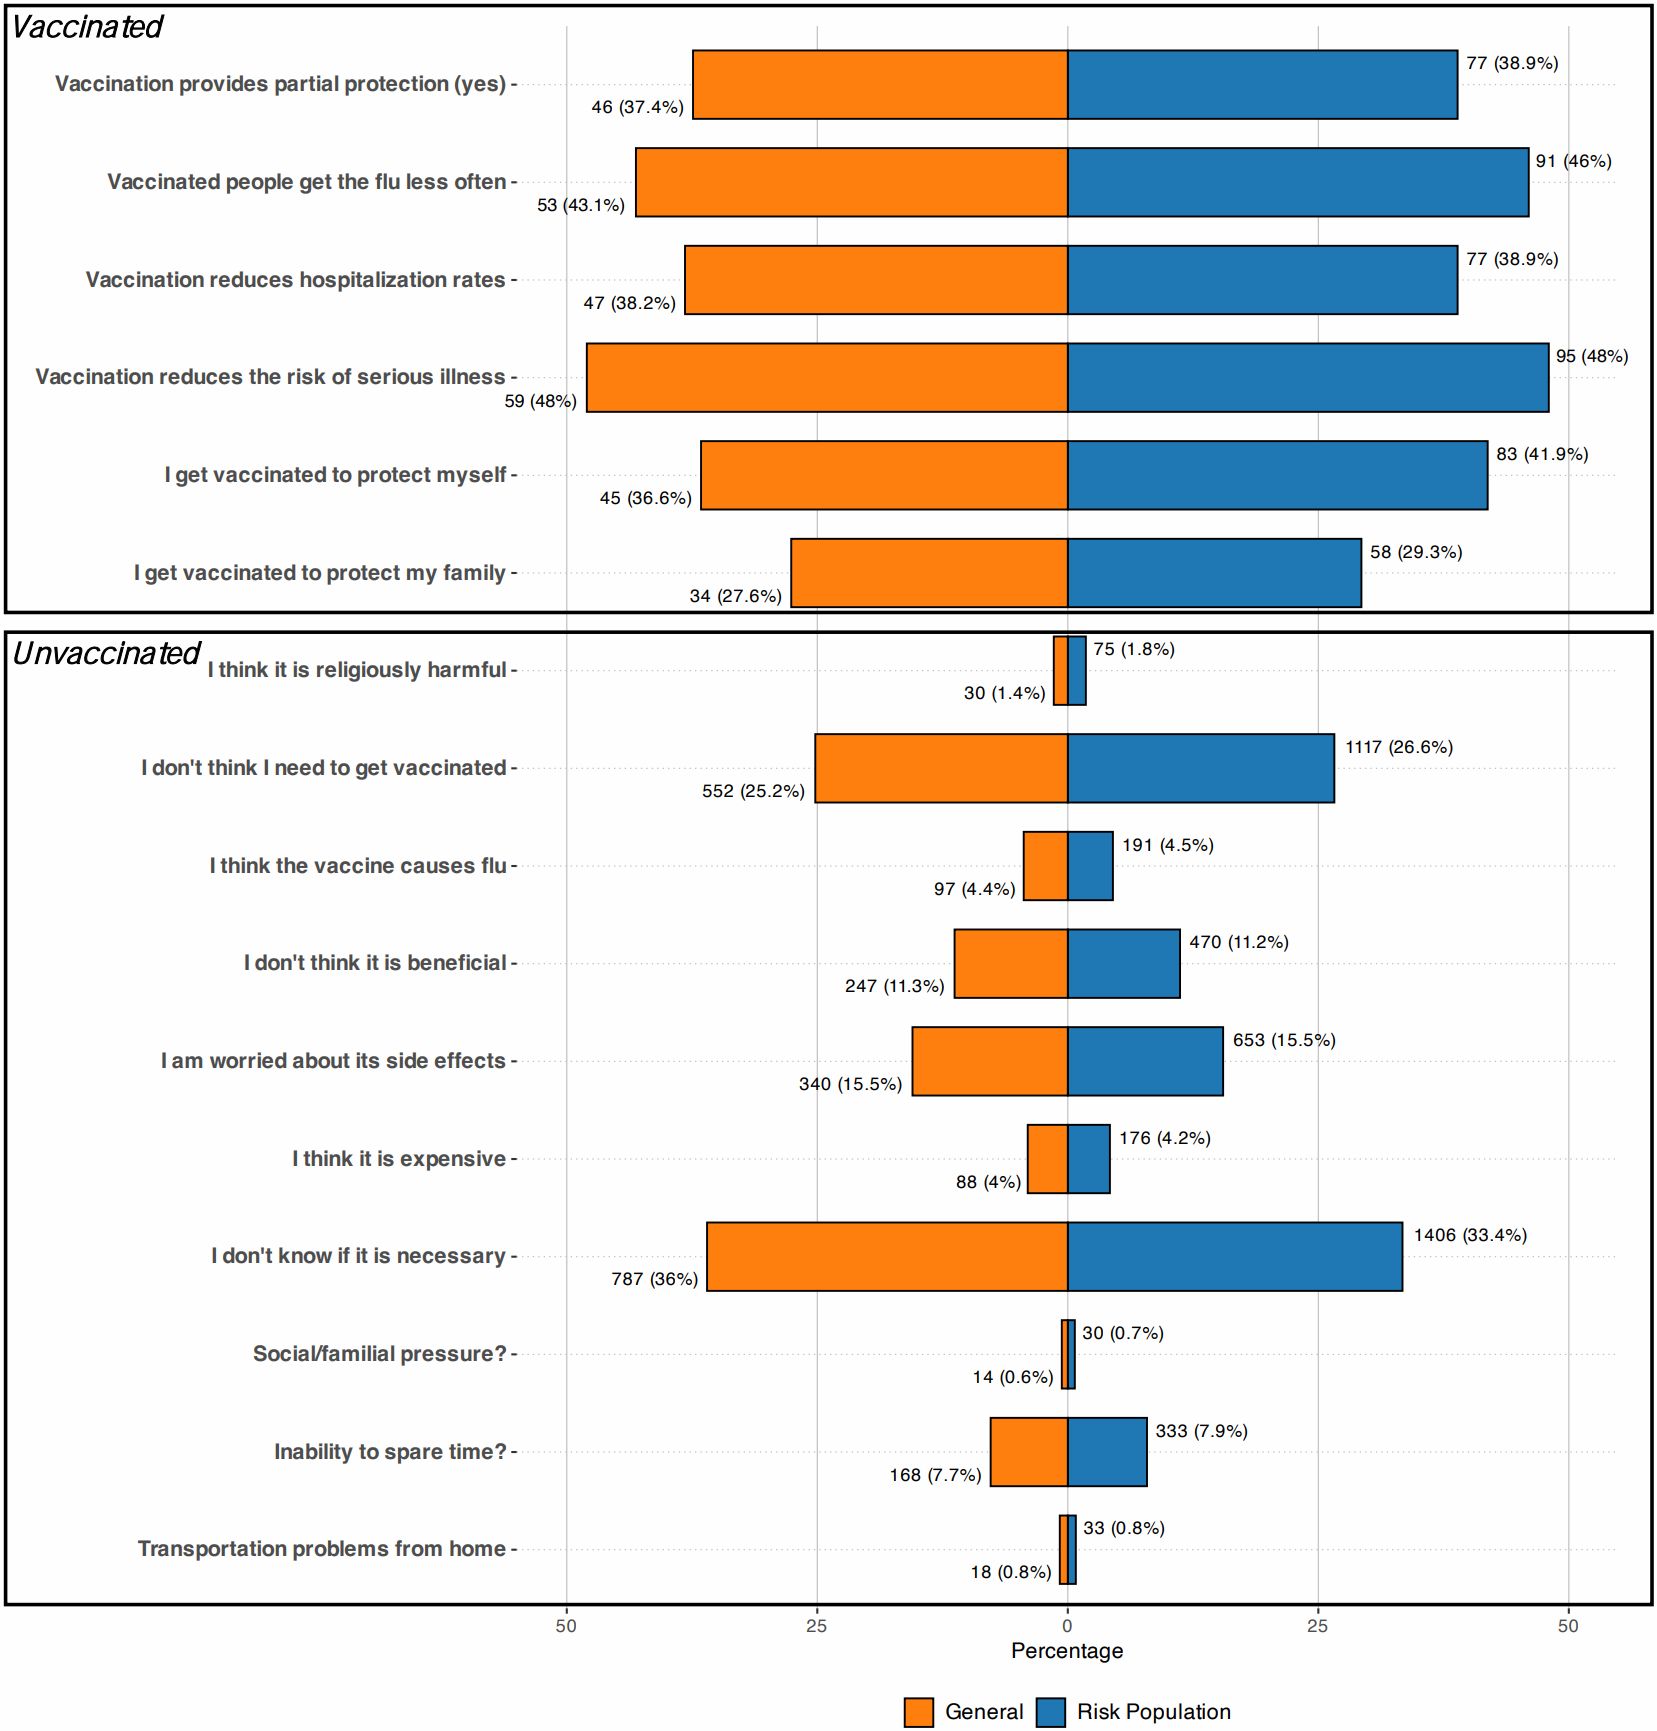
Attitudinal questions addressed six reasons for vaccination (e.g., belief that vaccination provides partial protection, reduces flu incidence and hospitalization, mitigates the risk of severe illness, or protects the individual and their family) and ten reasons for not vaccinating (e.g., religious objections, perceived lack of necessity or effectiveness, concerns about side effects, cost, lack of awareness, fear of social or familial disapproval, time constraints, or logistical barriers). Additionally, parents were asked about their sources of vaccination information, including doctors, pharmacists, neighbors, friends, and the media. Respondents could select multiple answers for each question.
Children identified as being in high-risk groups for severe influenza infection were specifically assessed. These included children under five years old, those aged 6 months to 18 years requiring long-term aspirin use, and those with chronic health conditions, such as metabolic diseases (e.g., diabetes), chronic respiratory diseases (e.g., asthma), chronic kidney disease, immunosuppressive conditions (e.g., chronic blood diseases, cancer, or immunosuppressive therapy), and chronic cardiovascular diseases.
Participants who declined to participate or provided insufficient or contradictory responses were excluded from the study.
Statistical analysis
The analyses were conducted using the free and open-source software R (version 4.4.1, https://cran.r-project.org) and the SPSS for Windows Version 23.0 statistical package (Chicago, IL), with the assistance of an academic biostatistician. Descriptive statistics were presented as mean±SD and frequencies (percentages) as appropriate. To compare the differences between the groups, Student’s t-test, was used for continuous variables, and Pearson’s chi-square test, Fisher’s exact test and Fisher-Freeman Halton test, as appropriate, were used for categorical variables. The Fisher-Freeman-Halton test was calculated in R software using the “Fisher.test” function. Variables associated with non-vaccination in univariate analyses at a threshold of p<0.20 were included in the multiple binary logistic regression model. Multiple binary logistic regression analysis was performed to identify independent risk factors associated with non-vaccination status for influenza, and results were reported as odds ratios with 95% confidence intervals. Model fit was evaluated using the Hosmer–Lemeshow goodness-of-fit test, and the model’s classification performance was summarized using the overall accuracy, sensitivity, and specificity. A p-value of less than 5% was considered statistically significant.
Results
This study, conducted across 38 hospitals in Türkiye, provides a comprehensive analysis of influenza vaccination rates and the factors influencing vaccination among pediatric patients (Table I). A total of 5,002 pediatric patients were surveyed. After excluding patients younger than 6 months and those with incomplete data, the analysis included 4,404 patients, of whom 195 (4.4%) had received an influenza vaccine, while 4,209 (95.6%) had not.
|
Numerical data are presented as mean±SD. Categorical variables reported as frequency (percent). Differences between groups were analyzed using: aStudent’s t-test, bPearson chi-squared test, c Fisher-Freeman Halton test. *: Bulgarian immigrant, Balkan, Afghan, Iraqi, Turkmen, Sudanese HPV: human papilloma virus, SD: standard deviation. |
||||
| Table I. Social characteristics of participants whom vaccinated and unvaccinated with influenza vaccine. | ||||
|
|
|
|
|
|
| Demographic characteristics | ||||
| Age, years, mean±SD |
|
|
|
|
| Male sex, n (%) |
|
|
|
|
| Underlying diseases, n (%) |
|
|||
| No disease |
|
|
|
|
| Congenital heart |
|
|
|
|
| Endocrinological |
|
|
|
|
| Gastrointestinal |
|
|
|
|
| Hematologic |
|
|
|
|
| Immunodeficiency |
|
|
|
|
| Kidney |
|
|
|
|
| Malignancy |
|
|
|
|
| Metabolic |
|
|
|
|
| Neurologic |
|
|
|
|
| Pulmonary |
|
|
|
|
| Rheumatological |
|
|
|
|
| Others* |
|
|
|
|
| Childhood vaccination coverage, n (%) |
|
|||
| Never vaccinated |
|
|
|
|
| Incompletely vaccinated |
|
|
|
|
| Full vaccinated |
|
|
|
|
| Special vaccinations coverage, n (%) |
|
|||
| Never vaccinated |
|
|
|
|
| Rotavirus vaccine |
|
|
|
|
| Meningococcus vaccine |
|
|
|
|
| HPV vaccine |
|
|
|
|
| Rotavirus+meningococcus |
|
|
|
|
| Rotavirus+meningococcus+ HPV |
|
|
|
|
| Meningococcus+ HPV |
|
|
|
|
| Parental characteristics | ||||
| Age, years, mean±SD | ||||
| Mother |
|
|
|
|
| Father |
|
|
|
|
| Education level of mother, n (%) |
|
|||
| Illiterate |
|
|
|
|
| Primary education |
|
|
|
|
| Lower secondary education |
|
|
|
|
| Upper secondary education |
|
|
|
|
| Undergraduate |
|
|
|
|
| Graduate |
|
|
|
|
| Education level of father, n (%) |
|
|||
| Illiterate |
|
|
|
|
| Primary education |
|
|
|
|
| Lower secondary education |
|
|
|
|
| Upper secondary education |
|
|
|
|
| Undergraduate |
|
|
|
|
| Graduate |
|
|
|
|
| Working status of mother, n (%) |
|
|||
| Government employee |
|
|
|
|
| Homemaker |
|
|
|
|
| Other |
|
|
|
|
| Working status of father, n (%) |
|
|||
| Government employee |
|
|
|
|
| Private-sector employee |
|
|
|
|
| Other |
|
|
|
|
| Number of siblings, n (%) |
|
|||
| Only child |
|
|
|
|
| Two children in the family |
|
|
|
|
| Three or more children |
|
|
|
|
| Decision maker for child, n (%) |
|
|||
| Mother |
|
|
|
|
| Father |
|
|
|
|
| Other |
|
|
|
|
| Father and Mother |
|
|
|
|
| Socioeconomic indicators, n (%) | ||||
| Income status |
|
|||
| Under $1000 |
|
|
|
|
| Over $1000 |
|
|
|
|
| Not specified |
|
|
|
|
| Number of rooms in the house |
|
|||
| 2+1 |
|
|
|
|
| 3+1 |
|
|
|
|
| 4+1 |
|
|
|
|
| House type |
|
|||
| Slum |
|
|
|
|
| Apartment |
|
|
|
|
| Other |
|
|
|
|
| Presence of grandparents or other individuals living in the same home |
|
|||
| No |
|
|
|
|
| Yes |
|
|
|
|
| Healthcare Behaviors, n (%) | ||||
| Routine control in the same doctor or hospital |
|
|||
| Regular follow-up |
|
|
|
|
| Irregular follow-up |
|
|
|
|
| No prior follow-up |
|
|
|
|
| Influenza vaccination status of parents in this year |
|
|||
| Yes |
|
|
|
|
| No |
|
|
|
|
| How many times have you had an influenza vaccine before? |
|
|||
| Have received the vaccine at least once in your life |
|
|
|
|
| Getting the vaccine regularly |
|
|
|
|
| Never happened |
|
|
|
|
| Have you ever heard of the influenza vaccine? |
|
|||
| Yes |
|
|
|
|
| No |
|
|
|
|
| Who recommended the influenza vaccine? |
|
|||
| Doctor |
|
|
|
|
| Neighbor |
|
|
|
|
| Pharmacist |
|
|
|
|
| Media |
|
|
|
|
| Friend |
|
|
|
|
| Other |
|
|
|
|
| Ethnicity |
|
|||
| Not wanted to specify |
|
|
|
|
| Turkish |
|
|
|
|
| Kurdish |
|
|
|
|
| Arab |
|
|
|
|
| Syrian |
|
|
|
|
| Other* |
|
|
|
|
The mean age of vaccinated children was 7.77 ± 4.92 years, compared to 7.11 ±4.95 years in unvaccinated children, with no statistically significant difference in mean ages (p = 0.067). Among vaccinated children, 54.4% (n = 106) were male, while 52.3% (n = 2,200) of unvaccinated children were male.
However, the prevalence of underlying chronic conditions, such as pulmonary diseases (15.1%), neurological disorders (6.3%), and other chronic illnesses, was significantly higher in the vaccinated group compared to the unvaccinated group, with a significant difference (p < 0.001).
Overall influenza vaccination rates
Although the rate of being fully vaccinated with childhood vaccines was higher in the influenza-vaccinated group (97.4%) compared to the unvaccinated group (94%), the difference was not statistically significant (p = 0.089). None of the patients who received the influenza vaccine had completely avoided childhood vaccinations, whereas 1.7% (n = 73) of those in the unvaccinated group had never received any vaccines. Additionally, 2.6% (n = 5) of the influenza-vaccinated group were incompletely vaccinated with childhood vaccines, compared to 4.2% (n = 178) in the unvaccinated group.
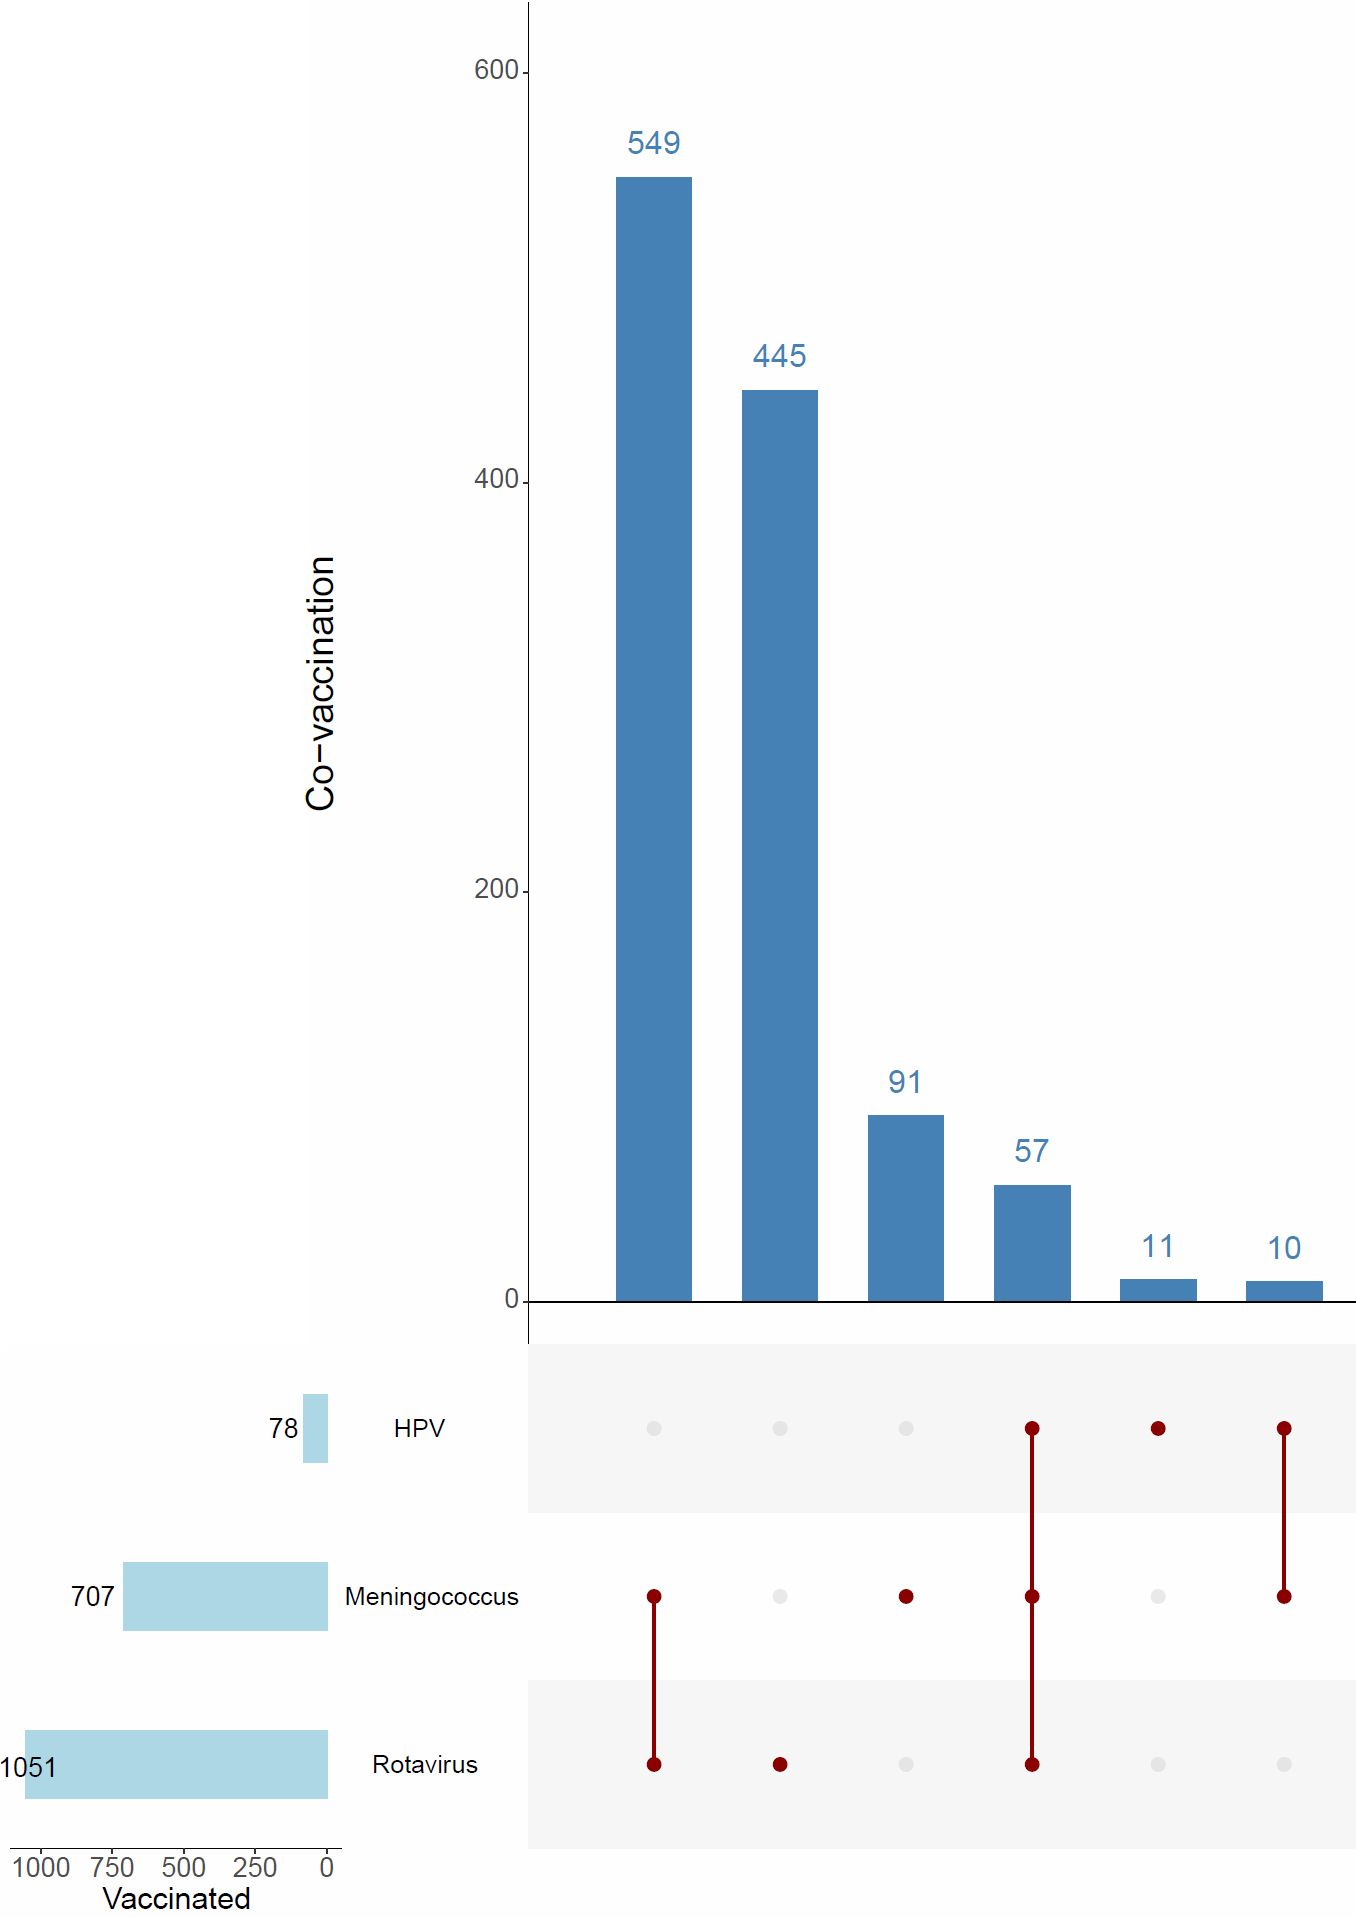
Regarding special vaccines, in the vaccinated group, 6.4% (n = 12) had received the rotavirus vaccine, 5.9% (n = 11) the meningococcal vaccine, 35.1% (n = 66) both the rotavirus and meningococcal vaccines, and 3.7% (n = 7) a combination of rotavirus, meningococcal, and human papilloma virus (HPV) vaccines. Additionally, 0.5% (n = 1) received both HPV and meningococcal vaccines. In the unvaccinated group, 9.3% (n = 390) had received the rotavirus vaccine, 1.8% (n = 76) the meningococcal vaccine, 0.2% (n = 9) the HPV vaccine, 10.6% (n = 438) both the rotavirus and meningococcal vaccines, 1.1% (n = 45) a combination of rotavirus, meningococcal, and HPV vaccines, and 0.2% (n = 9) both HPV and meningococcal vaccines. The overall rate of receiving special vaccines was significantly higher in the influenza-vaccinated group compared to the unvaccinated group (p < 0.001).
Parental sociodemographic characteristics
Both maternal and paternal education levels were significantly higher in the influenza-vaccinated group compared to the unvaccinated group (p < 0.001). The proportion of mothers employed as government employees was 27.7% (n = 53) in the vaccinated group, compared to 18.8% (n = 789) in the unvaccinated group, with this difference being statistically significant (p < 0.001). There was no significant difference between the groups regarding the number of siblings (p = 0.150). Notably, mothers were the primary decision-makers for their child’s healthcare in 58.5% (n = 114) of cases in the vaccinated group, compared to 55.2% (n = 2,314) in the unvaccinated group, a difference that was statistically significant (p = 0.009).
There were no significant differences between the groups in terms of income status, number of rooms, or housing type (p = 0.677, p = 0.023, p = 0.092, respectively). Similarly, no significant difference was observed regarding the presence of other individuals in the household (p = 0.996).
Healthcare behaviors and parental vaccine history
The proportion of children attending the same doctor for regular check-ups was higher in the vaccinated group, and this difference was statistically significant (p < 0.001).
The rate of parents receiving influenza vaccination was 42.8% (n = 83) in the vaccinated group, compared to 4.4% (n = 184) in the unvaccinated group, a significant difference (p < 0.001). Furthermore, the rate of children receiving influenza vaccination either regularly or at least once in the past was higher in the vaccinated group (p < 0.001).
Among participants, 93.3% (n = 181) in the vaccinated group had heard of the influenza vaccine, while 71.7% (n = 3,006) in the unvaccinated group had heard of it, with the vaccinated group having significantly higher awareness (p < 0.001). Additionally, 84.8% (n = 156) of those in the vaccinated group learned about the influenza vaccine through a doctor’s recommendation, compared to 49.6% (n = 1,710) in the unvaccinated group. This difference was also statistically significant (p < 0.001).
When examining the factors affecting the attitudes and perceptions of participants and participants in the risk group regarding influenza vaccination according to the vaccination status of their children, a high rate in both groups (Fig. 1) believed that vaccination would reduce the risk of serious illness in vaccinated individuals and that vaccinated individuals would have fewer flu attacks. Among those who were not vaccinated, a high rate in both groups were not informed about the necessity of vaccination and were unaware of the necessity of vaccination.
High-risk vs. non–high-risk groups
When assessing patients based on their risk group status, there were 2,327 patients in the risk group and 2,077 in the non-risk group (Table II). The mean age of the risk group was significantly lower (4.70 ± 4.65 years) compared to the non-risk group (9.87 ± 3.69 years), with a statistically significant difference (p < 0.001). The proportion of male patients in the risk group was 54.2% (n = 1,262), compared to 50.3% (n = 1,044) in the non-risk group, and this difference was statistically significant (p = 0.008).
|
Numerical data are presented as mean±SD. Categorical variables reported as frequency (percent). Differences between groups were analyzed using: aPearson chi-squared test, bStudent’s t-test, c Fisher-Freeman Halton test. HPV: human papilloma virus, SD: standard deviation. |
|||
| Table II. Social characteristics of participants in risk and non-risk group for severe influenza infection. | |||
|
|
|
|
|
| Demographic characteristics | |||
| Age, years, mean±SD |
|
|
|
| Sex, male, n (%) |
|
|
|
| Vaccination coverage, n (%) | |||
| Influenza |
|
||
| No |
|
|
|
| Yes |
|
|
|
| Childhood |
|
||
| Never had it done |
|
|
|
| Incompletely vaccinated |
|
|
|
| Full |
|
|
|
| Special |
|
||
| Never had it done |
|
|
|
| Rotavirus vaccine |
|
|
|
| Meningococcus vaccine |
|
|
|
| HPV vaccine |
|
|
|
| Rotavirus+meningococcus |
|
|
|
| Rotavirus+meningococcus+HPV |
|
|
|
| Meningococcus+HPV |
|
|
|
| Underlying disease, n (%) | |||
| No disease |
|
|
|
| Congenital heart |
|
|
|
| Endocrinological |
|
|
|
| Gastrointestinal |
|
|
|
| Hematologic |
|
|
|
| Immunodeficiency |
|
|
|
| Renal |
|
|
|
| Malignancy |
|
|
|
| Metabolic |
|
|
|
| Neurologic |
|
|
|
| Pulmoner |
|
|
|
| Rheumatological |
|
|
|
| Others* |
|
|
|
| Parental characteristics | |||
| Age, years, mean±SD | |||
| Mother |
|
|
|
| Father |
|
|
|
| Education level of mother, n (%) |
|
||
| Illiterate |
|
|
|
| Primary education |
|
|
|
| Lower secondary education |
|
|
|
| Upper secondary education |
|
|
|
| Undergraduate |
|
|
|
| Graduate |
|
|
|
| Education level of father, n (%) |
|
||
| Illiterate |
|
|
|
| Primary education |
|
|
|
| Lower secondary education |
|
|
|
| Upper secondary education |
|
|
|
| Undergraduate |
|
|
|
| Graduate |
|
|
|
| Working status of mother, n (%) |
|
||
| Government employee |
|
|
|
| Homemaker |
|
|
|
| Other |
|
|
|
| Working status of father, n (%) |
|
||
| Government employee |
|
|
|
| Private-sector employee |
|
|
|
| Other |
|
|
|
| Number of siblings, n (%) |
|
||
| Only child |
|
|
|
| Two children in the family |
|
|
|
| Three or more children |
|
|
|
| Decision maker for child, n (%) |
|
||
| Mother |
|
|
|
| Father |
|
|
|
| Other |
|
|
|
| Father and Mother |
|
|
|
| Socioeconomic indicators, n (%) | |||
| Income status |
|
||
| Under $1000 |
|
|
|
| Over $1000 |
|
|
|
| Not specified |
|
|
|
| Number of rooms in the house |
|
||
| 2+1 |
|
|
|
| 3+1 |
|
|
|
| 4+1 |
|
|
|
| House type |
|
||
| Slum |
|
|
|
| Apartment |
|
|
|
| Other |
|
|
|
| Presence of grandparents or other individuals living in the same home |
|
||
| No |
|
|
|
| Yes |
|
|
|
| Routine control in the same doctor or hospital |
|
||
| Regular follow-up |
|
|
|
| Irregular follow-up |
|
|
|
| No prior follow-up |
|
|
|
| Influenza vaccination status of parents in this year |
|
||
| Yes |
|
|
|
| No |
|
|
|
| How many times have you had an influenza vaccine before? |
|
||
| Have received the vaccine at least once in your life: |
|
|
|
| Getting the vaccine regularly: |
|
|
|
| Never happened: |
|
|
|
| Have you ever heard of the influenza vaccine? |
|
||
| Yes |
|
|
|
| No |
|
|
|
| Who recommended the influenza vaccine? |
|
||
| Doctor |
|
|
|
| Neighbor |
|
|
|
| Pharmacist |
|
|
|
| Media |
|
|
|
| Friend |
|
|
|
| Other |
|
|
|
The vaccination rate in the risk group was 5.2% (n = 123), significantly higher than the 3.5% (n = 72) in the non-risk group (p = 0.003). However, the full vaccination rate was lower in the risk group (93.2%, n = 2,167) compared to the non-risk group (95.2%, n = 1,969), and this difference was statistically significant (p < 0.001). Among those with incomplete vaccination, 5.2% (n = 121) were in the risk group, compared to 3% (n = 62) in the non-risk group. Those who had never been vaccinated comprised 1.5% (n = 36) in the risk group and 1.8% (n = 37) in the non-risk group.
In the risk group, the rates of receiving special vaccines were as follows: rotavirus vaccine 10% (n = 230), meningococcal vaccine 2.1% (n = 48), HPV vaccine 0.1% (n = 2), rotavirus and meningococcal vaccines 13.5% (n = 309), rotavirus, meningococcal, and HPV vaccines 1.5% (n = 34), and HPV and meningococcal vaccines 0.3% (n = 6). In the unvaccinated group, the corresponding rates were: rotavirus vaccine 8.5% (n = 171), meningococcal vaccine 2% (n = 41), HPV vaccine 0.3% (n = 7), rotavirus and meningococcal vaccines 9.7% (n = 195), rotavirus, meningococcal, and HPV vaccines 0.9% (n = 18), and HPV and meningococcal vaccines 0.2% (n = 4). The prevalence of chronic diseases such as pulmonary (9.7%, n = 225) and neurological (7%, n = 163) conditions was significantly higher in the risk group (p < 0.001).
Parents in the risk group were older (p < 0.001). The education levels of both mothers and fathers in the risk group were lower, and these differences were statistically significant (p < 0.001 and p = 0.003, respectively). A higher proportion of mothers in the risk group were homemakers (p < 0.001). Additionally, the risk group had a higher number of children, with this difference being statistically significant (p < 0.001).
Mothers acted as decision-makers for the child’s healthcare in 58.4% (n = 1,354) of cases in the risk group, compared to 51.9% (n = 1,074) in the non-risk group, with this difference being statistically significant. The proportion of families with an income below $1,000 was higher in the risk group (42% vs. 36.3%), with a statistically significant difference (p < 0.001). The risk group lived in smaller homes and more often in substandard housing, with significant differences in both categories (p < 0.001 and p = 0.007, respectively). The presence of additional individuals living in the same household was higher in the risk group.
The proportion of individuals in the risk group who followed up regularly with the same doctor was higher (67.3% vs. 58.2%), and this difference was statistically significant (p < 0.001). The rate of parents who received the influenza vaccination during the current season was higher in the risk group.
The rate of individuals who did not receive the flu vaccine in previous years was higher in the risk group, with a statistically significant difference (p = 0.006). The proportion of individuals who had previously heard of the influenza vaccine was higher in the risk group (73.1%, n = 1,696) compared to the non-risk group (72.2%, n = 1,491). Additionally, there was no significant difference between the two groups in terms of those who recommended the influenza vaccine (p = 0.373).
The multiple binary logistic regression analysis of individuals who did not receive the vaccine revealed that the most significant independent variables were not attending routine doctor check-ups and not having previously heard of the influenza vaccine (Table III).
|
Hosmer-Lemeshow chi-squared=2.498, p-value=0.962; overall accuracy=95.9. CI: confidence interval, OR: odds ratio. |
||
| Table III. Results of logistic regression analysis for risk factors affecting non-vaccination status of Influenza | ||
| Variables |
|
|
| House type (reference category: other) | ||
| Slum |
|
|
| Apartment |
|
|
| Routine control in the same doctor or hospital (reference category: regular) | ||
| Irregular follow-up |
|
|
| No prior follow-up |
|
|
| Not having heard of the influenza vaccine before (reference category: yes) |
|
|
| No special vaccination (reference category: yes) |
|
|
In the multiple binary logistic regression analysis (Table III), living in an apartment was associated with higher odds of non-vaccination compared with the reference housing category (“Other”) (odds ratio [OR]=2.059, 95% confidence interval [CI]: 1.318-3.218; p=0.002). Compared with individuals who reported attending routine check-ups (“Yes”), those attending occasionally (OR=3.270, 95% CI: 1.933-5.532; p<0.001) and those who never attended (OR=3.317, 95% CI: 1.408-7.815; p=0.006) had higher odds of non-vaccination. Additionally, variables referenced to “Yes” were significantly associated with non-vaccination, including influenza vaccination status this year (OR=4.280, 95% CI: 2.689-6.812; p<0.001), having heard of the influenza vaccine previously (OR=3.510, 95% CI: 1.715-7.187; p<0.001), and private vaccination (OR=2.126, 95% CI: 1.422-3.178; p<0.001). Regarding vaccination frequency, compared with “Regular” vaccination, being vaccinated at least once was associated with higher odds of non-vaccination (OR=2.738, 95% CI: 1.652-4.539; p<0.001), while never being vaccinated showed a markedly higher odds (OR=7.614, 95% CI: 4.124-14.056; p<0.001). Model fit was assessed using the Hosmer–Lemeshow test (χ2=2.498; p=0.962), indicating no evidence of poor fit. At the 0.50 probability cutoff, the fitted model showed 99.7% sensitivity for identifying non-vaccinated individuals and 10.7% specificity for identifying vaccinated individuals, with an overall accuracy of 95.9%. The relatively low specificity is likely related to the pronounced class imbalance (a substantially smaller vaccinated group), which can bias classification toward the majority class.
Among the 5002 patients included in the survey, 93% were fully vaccinated, 5% were incompletely vaccinated, and 2% had not been vaccinated at all. Of the patients, 3716 had not received any special vaccinations, while 1051 had received the rotavirus vaccine, 707 had received the meningococcal vaccine, and 78 had received the HPV vaccine (Fig. 2).
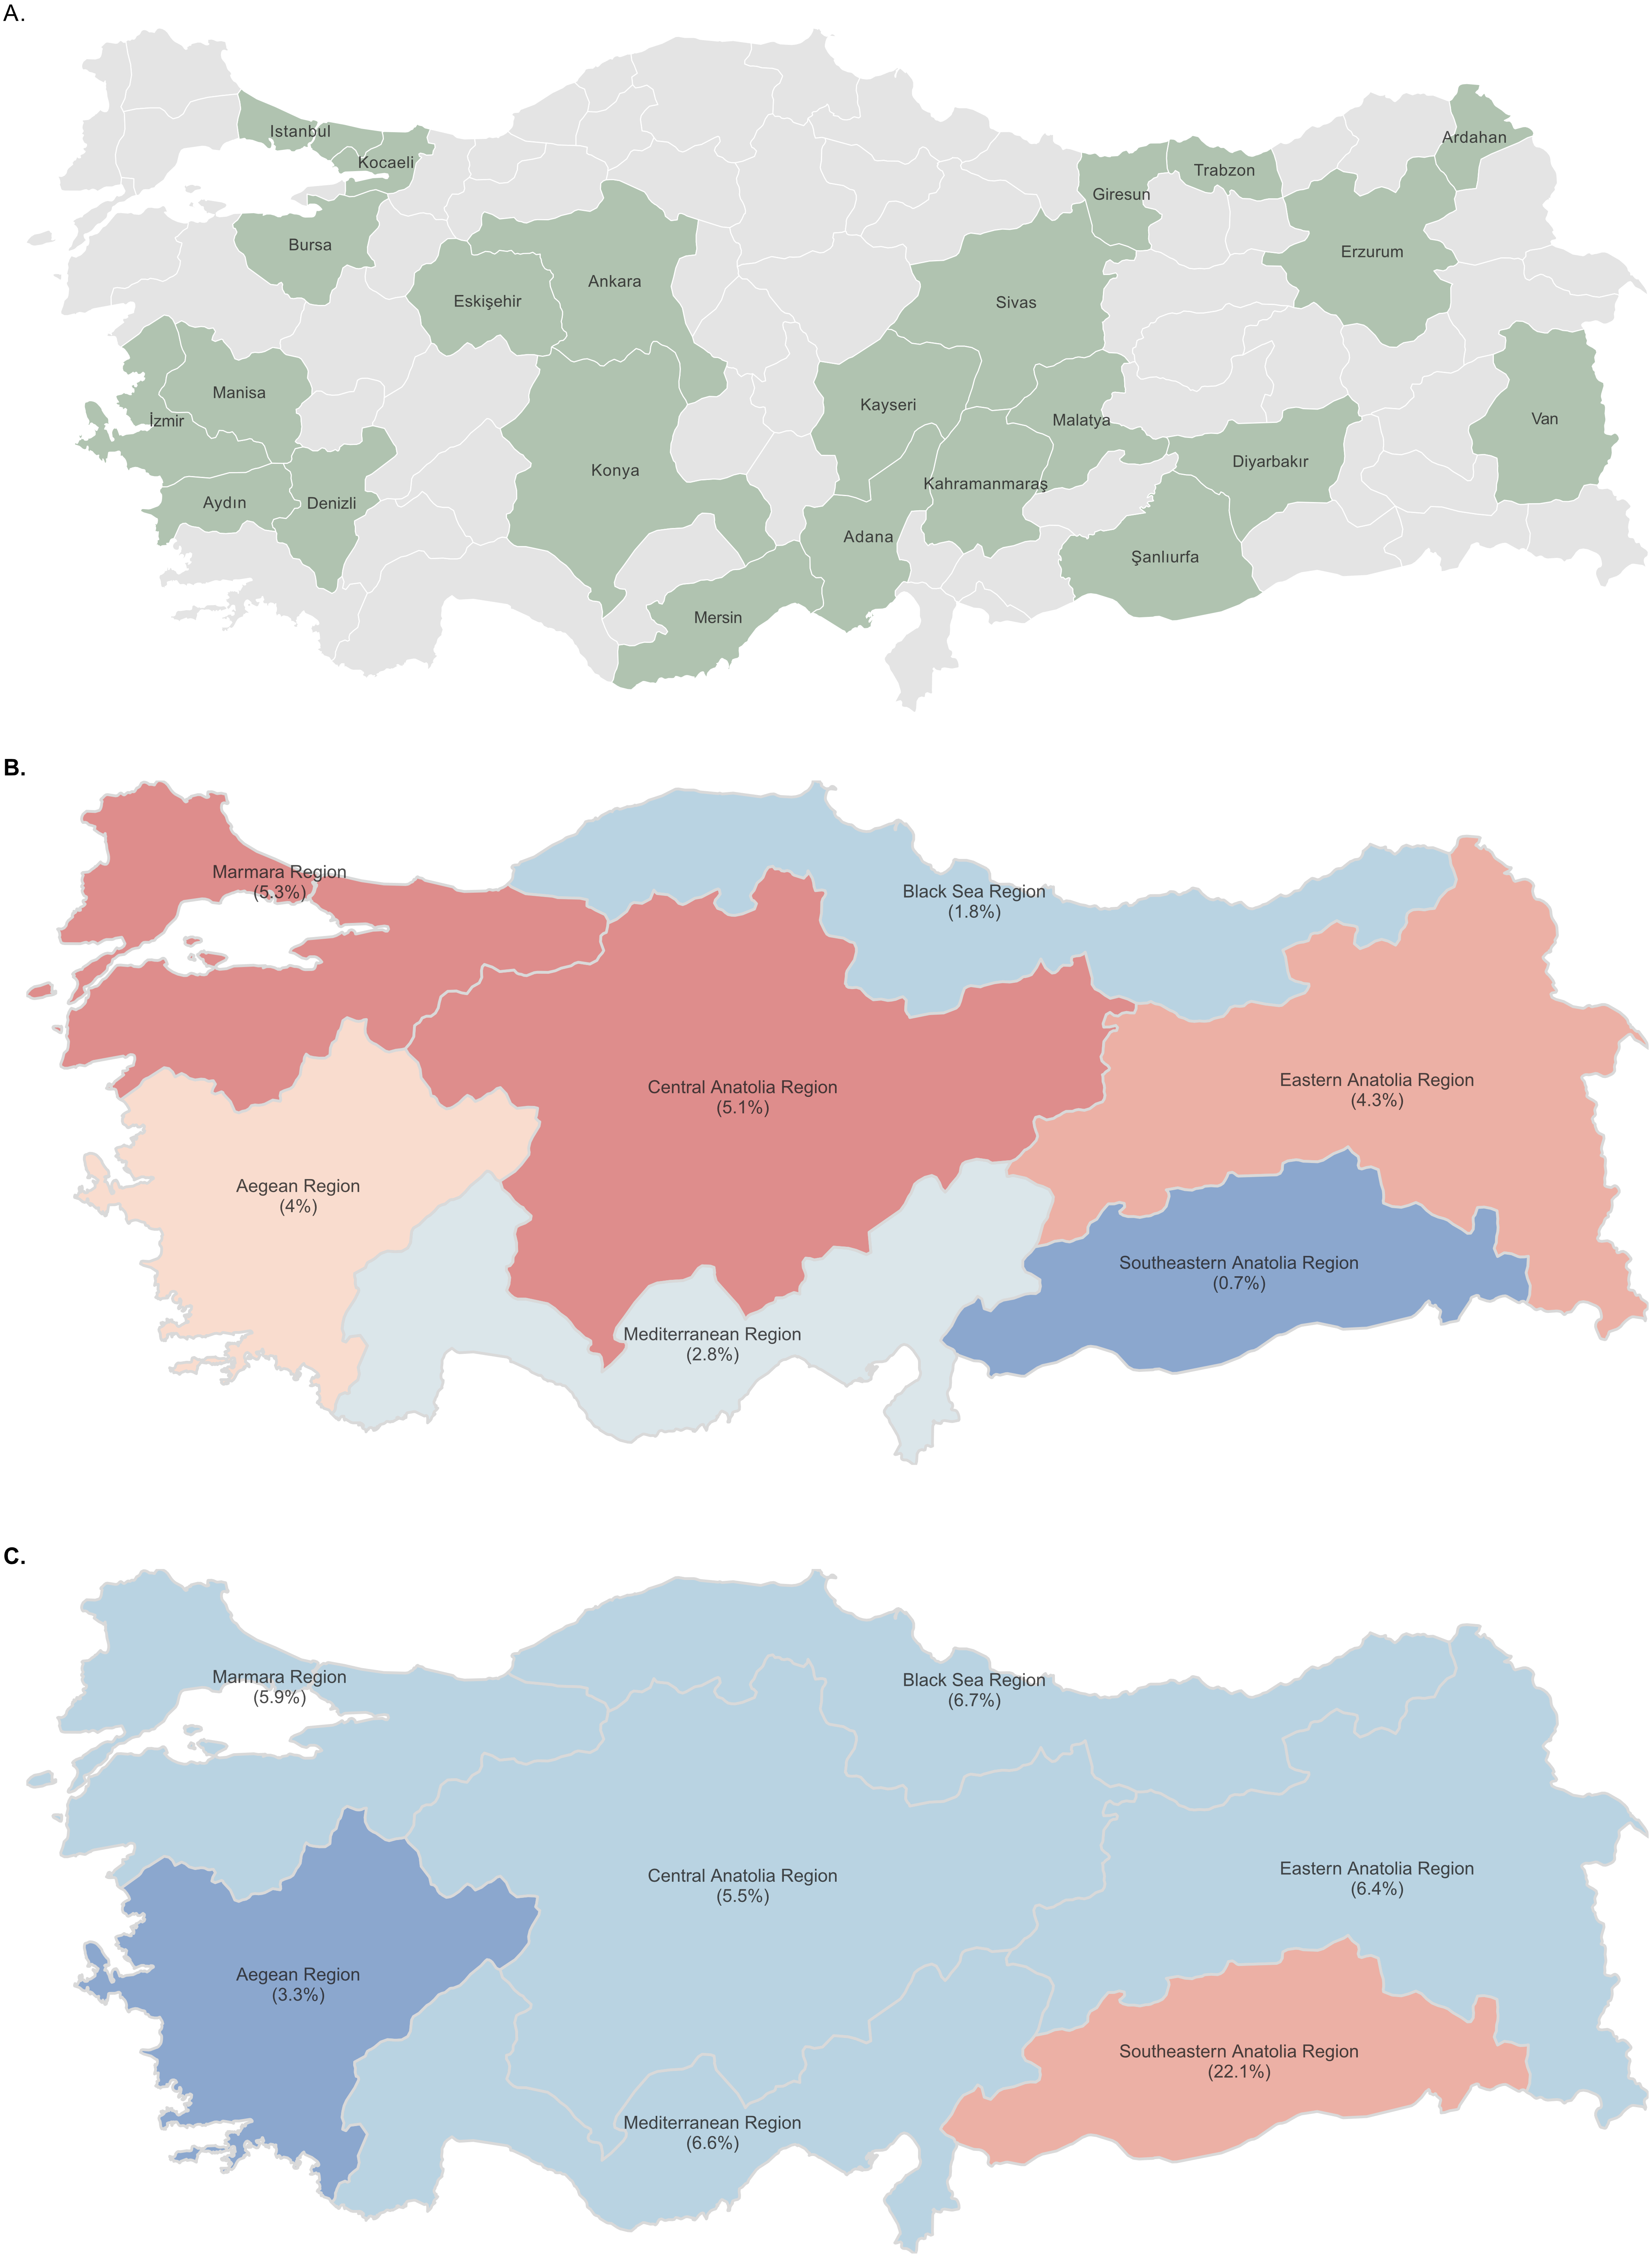
The distribution of provinces contributing survey data to our study is shown on the map of Türkiye (Fig. 3A). According to the obtained data, the regional distribution of influenza vaccination rates in Türkiye and the rates of not having childhood vaccines included in the Ministry of Health vaccination calendar are shown (Fig. 3B and Fig. 3C).
Discussion
In Türkiye, influenza vaccination rates among children have been found to be quite low at only 4.4%, largely because it is not routinely included in the national immunization schedule outside of target groups. Furthermore, even when specific groups are included, no childhood group has a vaccination rate exceeding 5.2%. Although data on influenza vaccination rates among children in Türkiye are limited, existing studies provide a consistent picture. For instance, data published from the 2016-2017 autumn-winter period revealed that the influenza vaccination rate among hospitalized pediatric patients stood at just 1.6%.19 In a study conducted under the leadership of our department, involving approximately 19 centers and including 1032 hospitalized pediatric patients with influenza, the vaccination rate among children was found to be 1.2% (unpublished data). Another Turkish study focusing on both adult and pediatric cases reported vaccination rates of only 0.3% and 2.1% for children under five in the 2014-2015 and 2015-2016 seasons, respectively.20 In stark contrast, countries like the United Kingdom and the United States report much higher influenza vaccination coverage in young children. For instance, the United Kingdom has a combined vaccination rate of 44.4% among children aged 2-3 years during recent seasons.21 Similarly, influenza vaccination rates for American children between 6 months and 17 years exceeded 55% annually from 2019 to 2023. However, despite these seemingly high rates, it is still observed that the majority of children who die from influenza in the United States are unvaccinated. According to estimates from the Centers for Disease Control and Prevention (CDC), during the 2022-2023 influenza season, approximately 21,000 individuals died from flu-related illnesses or complications, including 176 children, the majority of whom had not received the influenza vaccination.22 An interesting point is that even in countries such as Peru, where influenza vaccination is provided free of charge, vaccination rates can remain very low.23
Therefore, in this study, our primary aim was to understand the factors, particularly from the parents’ perspective, that contribute to vaccination uptake, or rather the lack thereof.
In the current study, it is observed that individuals with underlying health conditions are more likely to be vaccinated. For these children, the most motivating factor for vaccination appears to be information provided by their doctors. On the other hand, those who did not receive the vaccine were mostly influenced by information they encountered in the media. These data highlights that the most reliable and accurate information comes from healthcare professionals. Additionally, this finding emphasizes the importance of enhancing risk communication strategies to promote vaccination, with a particular focus on high-risk groups such as children, pregnant women, and older adults, who are more vulnerable to influenza-related complications.23-25
Our logistic regression analysis further confirmed this, showing that poor attendance at routine pediatric check-ups, lack of awareness of influenza vaccination, and absence of private vaccinations were strong predictors of non-vaccination. These findings highlight critical gaps in both preventive healthcare utilization and public awareness. From a policy perspective, integrating influenza vaccination counseling into routine pediatric visits and implementing nationwide awareness campaigns could be effective strategies to improve uptake. Strengthening these preventive healthcare opportunities may therefore play a pivotal role in reducing influenza-related morbidity and mortality in children.
Higher educational levels appear to significantly influence vaccine acceptance. The proportion of mothers with higher education is 14.9%, which is three times higher than the rate among parents in the unvaccinated group. This becomes even more significant considering that nearly 60% of decision-making within the household is typically made by mothers. Similarly, the percentage of fathers with higher education is 20%, which is also three times higher than the rate observed among parents in the unvaccinated group. Another piece of evidence supporting the importance of parental awareness is the high vaccination rate among the parents themselves. In light of the data from our study, the primary behavioral pattern behind not being vaccinated against influenza is not, as commonly believed, concerns about vaccine side effects. Rather, it is the lack of awareness regarding the necessity of the influenza vaccine and, in some cases, the importance of vaccinating their children. Similarly, a systematic review reported that sociodemographic factors, including age and education, along with the lack of recommendations from healthcare professionals to the primary decision-makers (i.e., parents of children aged 6–59 months), were identified as the most common barriers to seasonal influenza vaccine uptake in children.24 In our study, a considerable proportion of parents also reported “fear of side effects,” highlighting the need for physicians to address safety concerns through clear, evidence-based communication.
Although factors such as a physician’s guidance take precedence in general vaccination, economic reasons appear to be influential in the vaccination of high-risk groups. A previous study conducted by our center demonstrated that underlying diseases in children are the most significant risk factor for both hospital admission and intensive care unit (ICU) admission. Furthermore, the median age of children requiring ICU admission due to influenza was reported to be under 2 years.26 In another study, which included our department, comparing pediatric patients with coronavirus disease 2019 (COVID-19) and influenza, it was observed how influenza particularly affects children under the age of five.27 When examining the data from our study, it is evident that the vaccinated individuals tend to be older. These findings, therefore, underscore the critical importance of including children under 5 years of age in healthcare coverage, particularly in resource-limited countries like Türkiye.
The vaccination rate for all childhood vaccines among those vaccinated for influenza is 97.4%. However, our study identified that 73 (1.7%) children had not received any vaccinations as part of the national immunization program. The overall vaccination rate within our cohort was found to be 94.2%. This rate is notably lower than the figures reported to the World Health Organization on Türkiye.28 This decline is a significant indicator of the extent to which vaccine refusal in Türkiye has contributed to recent years. It was also observed that 35.4% of parents in this group had administered private vaccines that are not included in Türkiye’s national immunization schedule to their children, a rate that is three times higher than that of children who were not vaccinated against influenza. This finding further illustrates the willingness of families who have vaccinated their children against influenza to pursue additional vaccinations, independent of financial considerations. It reinforces the notion that, for parents, the key determinant in vaccination decisions is not cost, but rather awareness and understanding of the importance of immunization.
This study has several limitations. Although the survey was conducted face-to-face, which generally enhances the accuracy of responses compared to anonymous surveys, it still carries the potential for interviewer bias. The presence of the interviewer may have influenced participants’ answers, especially when it comes to sensitive topics like vaccination decisions. Additionally, while the sample included over 5,000 children and their parents, the study sample may not be fully representative of the wider population, limiting the generalizability of the findings. Other factors, such as healthcare access, socioeconomic status, and cultural beliefs, were not comprehensively explored, which could affect vaccination decisions but were outside the scope of this survey. Finally, as the study was cross-sectional, it provides a snapshot of associations at a single point in time and does not allow for the determination of causal relationships.
In conclusion, this study highlights the alarmingly low influenza vaccination rates among children in Türkiye, particularly in comparison to other countries with more established vaccination programs. The findings suggest that parental awareness plays a crucial role in vaccination uptake, with factors such as educational level, healthcare guidance, and awareness of the importance of the vaccine being significant contributors. Importantly, the data suggests that the primary barrier to vaccination is not vaccine side effects but rather a lack of understanding of the necessity of influenza vaccination, especially for children under the age of five. Healthcare professionals, particularly physicians, are key influencers in encouraging vaccination, and their guidance proves to be more effective than information from media sources. The study also underscores the need for targeted interventions aimed at high-risk groups, particularly young children and those with underlying health conditions, who remain vulnerable to severe influenza outcomes. The higher vaccination rates observed among children whose parents are more educated further emphasize the importance of increasing awareness and providing accurate information to parents. Given the limitations of the study, future research should explore broader socio-economic, cultural, and healthcare access factors that may also influence vaccination behavior. Additionally, longitudinal studies are necessary to understand the causal factors behind low vaccination rates and to evaluate the effectiveness of public health campaigns. Addressing the gaps in vaccination uptake in Türkiye, particularly through enhanced education and policy interventions, is critical for improving childhood influenza vaccination rates and reducing the burden of this preventable disease.
It is crucial to strengthen public health strategies in Türkiye. Free influenza vaccination should be considered for high-risk groups to increase coverage and reduce disease burden. Moreover, standardization of physician recommendations could play a key role in improving parental trust and ensuring more consistent uptake of the vaccine nationwide.
Ethical approval
The study was approved by Hacettepe University Faculty of Medicine Non-Interventional Clinical Research Ethics Committee (date: March 05, 2024, number: 2024/08-66).
Source of funding
The authors declare the study received no funding.
Conflict of interest
The authors declare that there is no conflict of interest.
References
- Iuliano AD, Roguski KM, Chang HH, et al. Estimates of global seasonal influenza-associated respiratory mortality: a modelling study. Lancet 2018; 391: 1285-1300. https://www.doi.org/10.1016/S0140-6736(17)33293-2
- World Health Organization (WHO). Influenza (Seasonal) Key Facts. 2023. Available at: https://www.who.int/news-room/fact-sheets/detail/influenza-(seasonal) (Accessed on Nov 17, 2024).
- Ampofo K, Gesteland PH, Bender J, et al. Epidemiology, complications, and cost of hospitalization in children with laboratory-confirmed influenza infection. Pediatrics 2006; 118: 2409-2417. https://doi.org/10.1542/peds.2006-1475
- Nair H, Brooks WA, Katz M, et al. Global burden of respiratory infections due to seasonal influenza in young children: a systematic review and meta-analysis. Lancet 2011; 378: 1917-1930. https://doi.org/10.1016/S0140-6736(11)61051-9
- Centers for Disease Control and Prevention. Update: Influenza activity-United States, 2009-10 season. Morb Mortal Wkly Rep 2010; 59: 901-908.
- Mantel C, Chu SY, Hyde TB, Lambach P; IPIE Pilot Implementation Group. Seasonal influenza vaccination in middle-income countries: assessment of immunization practices in Belarus, Morocco, and Thailand. Vaccine 2020; 38: 212-219. https://doi.org/10.1016/j.vaccine.2019.10.028
- World Health Organization (WHO). Vaccines against influenza: WHO position paper - May 2022. Available at: https://www.who.int/publications-detail-redirect/who-wer9719 (Accessed on Nov 17, 2024).
- Mereckiene J, Cotter S, Nicoll A, et al. Seasonal influenza immunisation in Europe. Overview of recommendations and vaccination coverage for three seasons: pre-pandemic (2008/09), pandemic (2009/10) and post-pandemic (2010/11). Euro Surveill 2014; 19: 20780. https://doi.org/10.2807/1560-7917.es2014.19.16.20780
- UK Health Security Agency. Annual flu programme. Available at: https://www.gov.uk/government/collections/annual-flu-programme (Accessed on Nov 17, 2024).
- Grohskopf LA, Alyanak E, Ferdinands JM, et al. Prevention and control of seasonal influenza with vaccines: recommendations of the advisory committee on immunization practices, United States, 2021-22 influenza season. MMWR Recomm Rep 2021; 70: 1-28. https://doi.org/10.15585/mmwr.rr7005a1
- Gupta V, Dawood FS, Muangchana C, et al. Influenza vaccination guidelines and vaccine sales in southeast Asia: 2008-2011. PLoS One 2012; 7: e52842. https://doi.org/10.1371/journal.pone.0052842
- Members of the Western Pacific Region Global Influenza Surveillance Response System; Dwyer D, Barr I, Hurt A, et al. Seasonal influenza vaccine policies, recommendations and use in the World Health Organization’s Western Pacific Region. Western Pac Surveill Response J 2013; 4: 51-59. https://doi.org/10.5365/WPSAR.2013.4.1.009
- Shono A, Kondo M. Factors associated with seasonal influenza vaccine uptake among children in Japan. BMC Infect Dis 2015; 15: 72. https://doi.org/10.1186/s12879-015-0821-3
- Yin JK, Heywood AE, Georgousakis M, et al. Systematic review and meta-analysis of indirect protection afforded by vaccinating children against seasonal influenza: implications for policy. Clin Infect Dis 2017; 65: 719-728. https://doi.org/10.1093/cid/cix420
- Cohen C, Kleynhans J, Moyes J, et al. Asymptomatic transmission and high community burden of seasonal influenza in an urban and a rural community in South Africa, 2017-18 (PHIRST): a population cohort study. Lancet Glob Health 2021; 9: e863-e874. https://doi.org/10.1016/S2214-109X(21)00141-8
- World Health Organization Regional Office for Europe. Influenza vaccination coverage, children first age-group. Copenhagen: WHO Regional Office for Europe; 2020. Available at: https://gateway.euro.who.int/en/indicators/infl_12-influenza-vaccination-coverage-children-first-age-group/#id=31632 (Accessed on Nov 17, 2024).
- World Health Organization Regional Office for Europe. Influenza vaccination coverage, children second age-group. Copenhagen: WHO Regional Office for Europe; 2020. Available at: https://gateway.euro.who.int/en/indicators/infl_13-influenza-vaccination-coverage-children-second-age-group/#id=31633 (Accessed on Nov 17, 2024).
- World Health Organization (WHO). Ten threats to global health in 2019. Geneva: WHO; 2019. Available at: https://www.who.int/news-room/spotlight/ten-threats-to-global-health-in-2019 (Accessed on Nov 17, 2024).
- Erat T, Özdemir H, Taşkınoğlu T, İnce E, Çiftçi E. Frequency of Influenza, Influenza Types and Influenza Vaccine Use in Hospitalized Children with Influenza-Like Symptoms. Mikrobiyol Bul 2020; 54: 318-325. https://doi.org/10.5578/mb.69358
- Tanriover MD, Bagci Bosi T, Ozisik L, et al. Poor outcomes among elderly patients hospitalized for influenza-like illness. Curr Med Res Opin 2018; 34: 1201-1207. https://doi.org/10.1080/03007995.2017.1381078
- UK Health Security Agency. Seasonal influenza vaccine uptake in GP patients in England: winter season 2023 to 2024. London: UK Health Security Agency; 2024. Available at: https://www.gov.uk/government/statistics/seasonal-influenza-vaccine-uptake-in-gp-patients-winter-season-2023-to-2024/seasonal-influenza-vaccine-uptake-in-gp-patients-in-england-winter-season-2023-to-2024 (Accessed on Nov 14, 2024).
- National Foundation for Infectious Diseases. Influenza Vaccination Coverage by Population (2019-2023). Bethesda: NFID; 2023. Available at: https://www.nfid.org/resource/influenza-vaccination-coverage-by-population/ (Accessed on Nov 14, 2024).
- Reinders S, Romero C, Carcamo C, et al. A community-based survey on influenza and vaccination knowledge, perceptions and practices in Peru. Vaccine 2020; 38: 1194-1201. https://doi.org/10.1016/j.vaccine.2019.11.016
- Schmid P, Rauber D, Betsch C, Lidolt G, Denker ML. Barriers of influenza vaccination intention and behavior - a systematic review of influenza vaccine hesitancy, 2005 - 2016. PLoS One 2017; 12: e0170550. https://doi.org/10.1371/journal.pone.0170550
- Chen MF, Wang RH, Schneider JK, et al. Using the Health Belief Model to understand caregiver factors influencing childhood influenza vaccinations. J Community Health Nurs 2011; 28: 29-40. https://doi.org/10.1080/07370016.2011.539087
- Ozsurekci Y, Aykac K, Bal F, et al. Outcome predictors of influenza for hospitalization and mortality in children. J Med Virol 2021; 93: 6148-6154. https://doi.org/10.1002/jmv.26833
- Yayla BCC, Aykac K, Boluk O, et al. The comparison of COVID-19 vs seasonal influenza in children. Pediatr Int 2023; 65: e15684. https://doi.org/10.1111/ped.15684
- World Health Organization (WHO). WHO Immunization Data portal - European Region: Türkiye. Geneva: WHO; 2024. Available at: https://immunizationdata.who.int/dashboard/regions/european-region/TUR (Accessed on Nov 14, 2024).
Copyright and license
Copyright © 2026 The Author(s). This is an open access article distributed under the Creative Commons Attribution License (CC BY), which permits unrestricted use, distribution, and reproduction in any medium or format, provided the original work is properly cited.