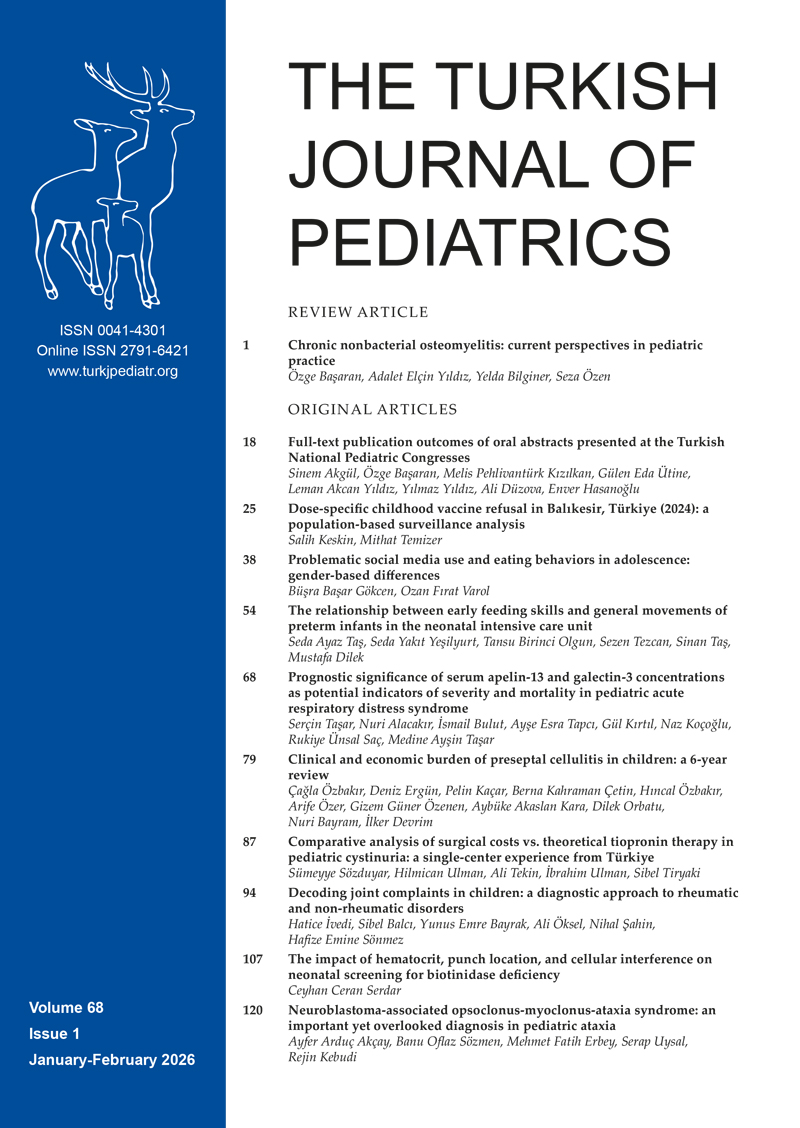
Graphical Abstract
Abstract
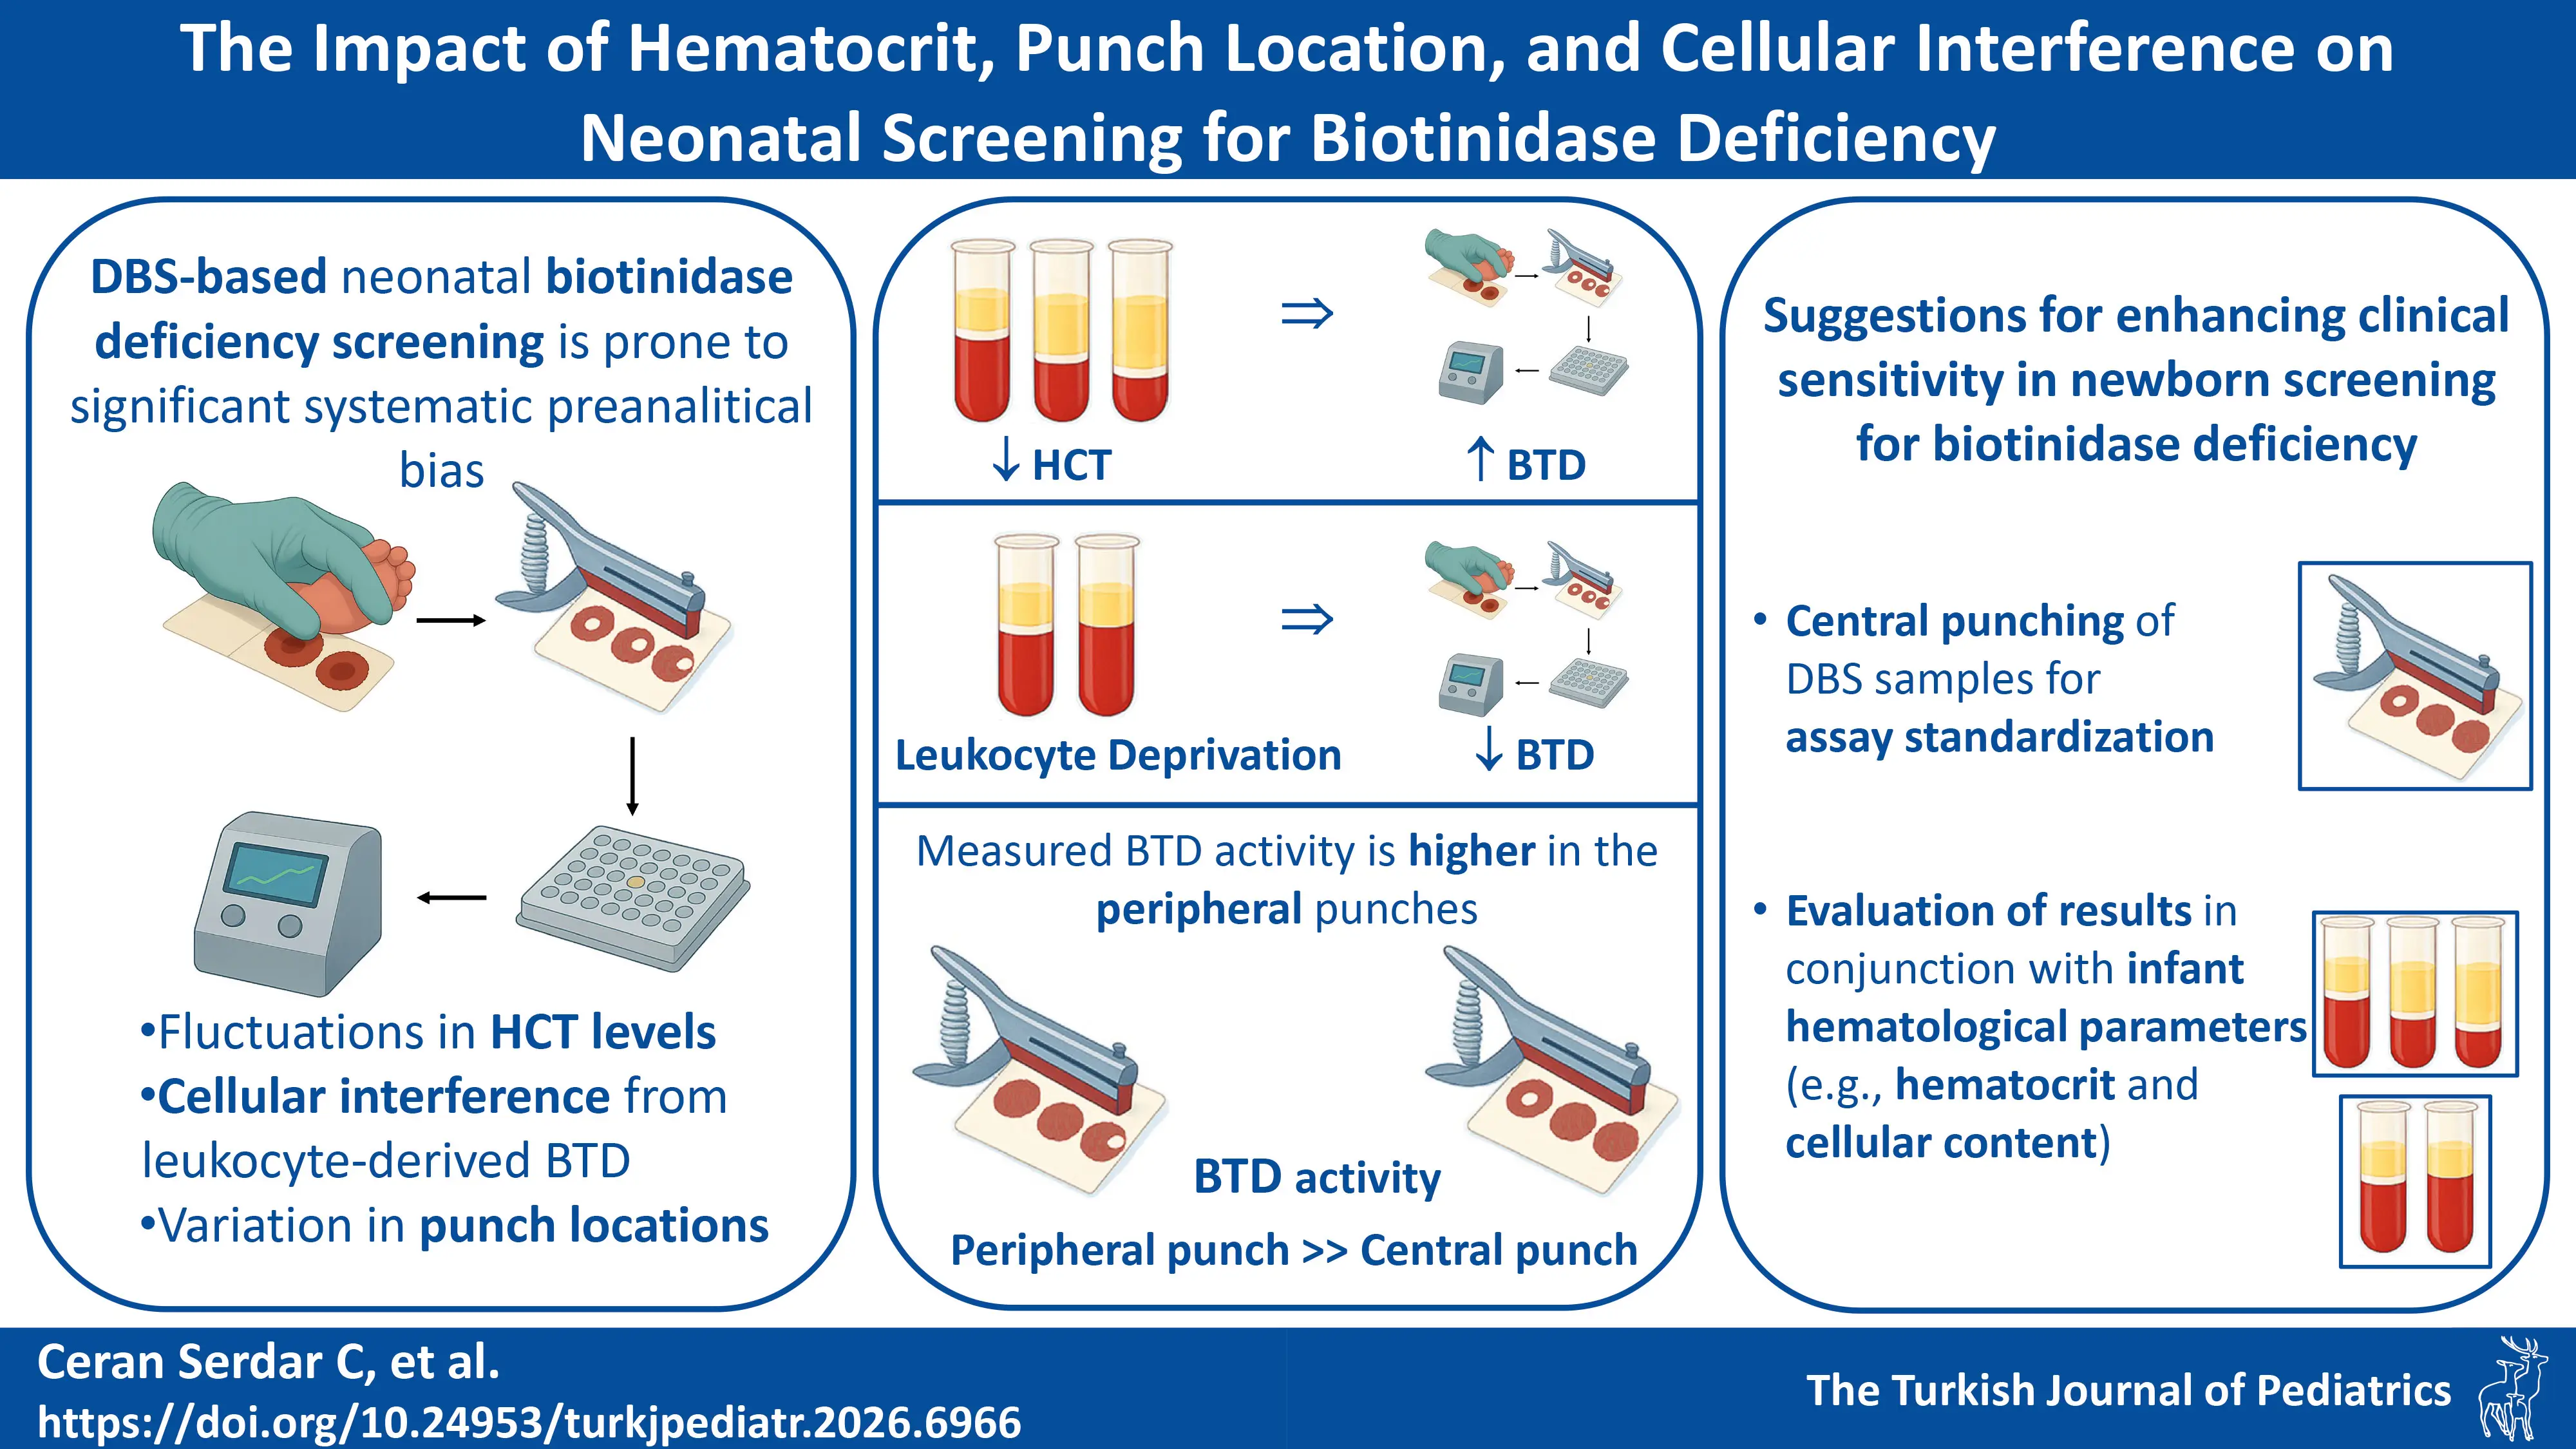
Background. Biotinidase deficiency is a core condition in newborn screening programs worldwide. While fluorometric enzyme activity assays from dried blood spots (DBS) are the standard first-tier test, their accuracy can be susceptible to pre-analytical variation. To date, the specific impact of hematocrit (HCT), punch location, and cellular interference on fluorometric biotinidase measurements have not been systematically examined.
Methods. We prepared blood pools to isolate specific variables: a reference pool at 50% HCT (HCT50), a low-HCT pool at 34% (HCT34), and a leukocyte-depleted pool (HCT50(-W)). Secondary pools were created with biotinidase activities of 0, 50, 100, and 200 U. DBS samples were prepared from all pools. Biotinidase activity was measured fluorometrically from central and peripheral punches (n=12 per condition). Statistical analysis included t-tests and Cohen’s d effect sizes, with a >10% deviation set as the threshold for clinical significance.
Results. Our results demonstrated a significant systematic bias: Peripheral punches yielded higher biotinidase activity than central punches across all sample types (13.36%–16.61% difference, p<0.05). Lower hematocrit (HCT34) led to a significant overestimation of activity, yielding >20% higher values at the critical biotinidase activity-50 U level. Crucially, leukocyte depletion resulted in a statistically significant decrease in measured activity (~10.6%, p<0.05), indicating that approximately 10% of the quantified activity in DBS is leukocyte-derived and constitutes a previously unaccounted source of analytical bias.
Conclusion. This study is the first to definitively quantify the effects of key pre-analytical variables on fluorometric biotinidase testing. Punch location, hematocrit, and cellular content are not merely sources of noise but are significant confounders that can lead to both false-positive and false-negative results. We strongly recommend that DBS calibrators and patient samples be punched from the center of the spot and that second-tier testing interpretations consider individual infant hematological parameters to enhance the clinical sensitivity of newborn screening for biotinidase deficiency.
Keywords: biotinidase deficiency, newborn screening, dried blood spot testing, punch location, hematocrit, filter paper
Introduction
Profound biotinidase deficiency (BD), which classically presents in infancy with a triad of neurological (seizures, hypotonia, ataxia, sensorineural hearing loss), dermatological (alopecia, eczematous rash), and metabolic manifestations, may progress to irreversible optic atrophy or cognitive impairment if left untreated. Late-onset cases in adolescence may present with motor weakness and visual disturbances.1 While biotin supplementation prevents the development of symptoms and reverses most active manifestations when initiated early in neonatal life, certain neurological complications - particularly developmental delay, hearing loss and optic atrophy - may become permanent if treatment is delayed.2 This dramatic treatment response, coupled with biotin’s exceptional safety profile, underscores the importance of newborn screening for BD.
Following the identification of BD in 1983, researchers developed a rapid colorimetric method in 1984 for the semiquantitative assessment of biotinidase activity in dried blood spots (DBS).3,4 This advancement enabled the first pilot newborn screening program for BD in Virginia that same year, with broader implementation by 1985.5 The introduction of this screening method into universal newborn screening programs enabled detection of both profound and partial deficiencies, with an estimated global incidence of ~1:60,000, and allowed for early treatment, significantly improving clinical outcomes.6
The Turkish neonatal screening program for BD started in 2008, initially utilizing a colorimetric assay before transitioning to a fluorometric assay in 2015, which utilizes biotinyl-6-aminoquinoline as a substrate, and offers enhanced clinical sensitivity and specificity for DBS analysis.2,7-9 The fluorometric assay, which outperforms the colorimetric method, offers the following critical improvements: 1) compatibility with 3 mm DBS disks instead of 6 mm, saving valuable DBS sample for additional neonatal screening tests; 2) enables single-plate processing (vs. 4 plates in the colorimetric assay), eliminating the need for specialized filter plates and inter-plate transfer steps, and reducing consumable costs by 75% (plate savings); 3) minimizes potential handling errors, enhancing methodological robustness, and improving inter-assay reproducibility; 4) uses DBS matrix-matched calibrators/controls (vs. solution-based calibrators in colorimetric assay); 5) reduces total assay time by 30 minutes; 6) offers lower detection limits and a wider detection range.9
The reliable detection of biotinidase deficiency hinges criticially on assay precision, especially near the decision threshold that distinguishes profound (<10% activity) from partial (10–30% activity) deficiency.10 While both profound (<10% activity) and partial (10–30% activity) deficiencies are treated with biotin supplementation, management protocols differ significantly: profound deficiency requires lifelong, high-dose (5-10 mg/day) biotin and urgent intervention to prevent severe neurological damage, whereas partial deficiency may need lower doses (2.5-10 mg/day) and is monitored for later-onset, often subtler symptoms.10 Misclassification near the 10% decision threshold—due to assay imprecision—can therefore lead to either overtreatment and unnecessary lifelong burden or, conversely, under-treatment and risk of preventable morbidity. Consequently, analytical precision at this cutoff is not a mere technical concern but a direct determinant of appropriate, personalized patient care.
DBS analysis has been a cornerstone of newborn screening programs since their inception, yet persistent analytical challenges —including several chromatographic and pre-analytical interference factors— can compromise assay accuracy. Most newborn screening assays utilize 3.2 mm punches from DBS. The diameter of a DBS is influenced by both the applied blood volume and hematocrit level (HCT), which collectively alter the blood, red blood cell (RBC), and serum volumes contained within each 3.2 mm punch. Variations in HCT levels (40–65%) alter blood viscosity, leading to non-uniform analyte distribution and punch-to-punch variability.11 Higher HCT levels reduce the serum volume per punch by 27% while more than doubling the RBC volume per punch, disproportionately affecting the quantity of RBC-associated and serum-associated analytes recovered per punch.11 Punch location introduces further bias, with peripheral punches yielding higher analyte concentrations than central punches for several key analytes quantitated in neonatal screening programs.12 While standardization efforts by the Clinical and Laboratory Standards Institute (CLSI) have reduced paper batch variability —minimizing matrix effects—, white blood cell (WBC) contaminants (e.g., clotting factors in native heel prick blood, which may be absent in reconstituted calibrators) can alter analyte recovery.11 Additionally, WBC lysis during drying has been suggested to release proteases or phosphatases, potentially degrading labile biomarkers like immunoreactive trypsin (IRT).12
Although the effects of blood volume and punch location have been investigated for tandem mass spectrometry (MS/MS)-quantified amino acids and acylcarnitines and enzyme-linked immunosorbent assay (ELISA)-based IRT and thyroid-stimulating hormone (TSH) measurements, no study to date has examined the impact of these chromatographic factors on fluorometric enzymatic activity assays for BD. Given that Türkiye screens over 1.2 million newborns annually, with BD incidence reaching 1:481 in certain regions, we aimed to investigate how pre-analytical factors affect the accuracy of fluorometric biotinidase activity assays.13,14 While biotinidase is primarily produced in the liver and circulates in serum, its presence in leukocytes and fibroblasts is well-documented.1 Although neonatal blood typically has a hematocrit of 50-55%, significant inter-individual variation exists. Therefore, we additionally examined how hematocrit variability and leukocyte content influence biotinidase activity measurements.
Materials and Methods
Preparation of DBS samples
A banked donor whole blood unit was obtained from the Turkish Red Crescent (Türk Kızılayı). The anonymized blood unit used in this analysis was procured as residual material, which had been designated for disposal by the Turkish Red Crescent. Use of residual materials for the production of quality assurance and control (QC) material production is explicitly authorized by the Republic of Türkiye Ministry of Health Directive (Circular 2013/19, No: 95966346), which provides the legal framework that enables the utilization of such otherwise-waste biological materials from public institutions. This study, which utilizes such material for QC-related methodological validation, falls within the scope of this directive. All personal identifiers were permanently removed by the source institution prior to our receipt, ensuring irreversible anonymization. The blood unit, whose HCT level was determined to be 34% on a Radim Seac HeCo automated analyzer (Radim Seac S.r.l., Pomezia, Italy), was divided into three portions to prepare blood pools with native HCT (measured to be 34%), 50% HCT, and 50% HCT-W (see below). HCT levels of the latter two were adjusted to 50% as explained in the following sub-section. As there is currently no method to determine biotinidase activity directly from whole blood, and biotinidase activity is measured in arbitrary units in the absence of a certified reference material (CRM), the biotinidase level of the undiluted form of each blood pool was designated as 200 U to simplify subsequent calculations. A serial dilution series was prepared from each pool to generate samples with decreasing biotinidase levels. To perform the dilutions, each of the three pools was aliquoted into two initial portions: a) 200 U BTD: Blood pools with peak biotinidase activity (untreated whole blood), b) 0 U BTD: Blood pools with no biotinidase activity. Biotinidase-deficient pools were prepared by centrifuging the whole blood to remove the serum fraction containing the biotinidase enzyme. The packed RBCs were then washed with phosphate buffer and reconstituted to target HCT levels, effectively replacing all native serum with phosphate buffer (containing 3% albumin) to eliminate enzymatic activity. Blood pools with intermediate biotinidase activities of 100 U and 50 U were generated through the serial 1:1 dilution of the 200 U pools with the corresponding BTD-deficient (0 U) pools. All four levels were employed in the experiments. DBS samples were prepared by pipetting 50 μL aliquots from each blood pool onto pre-labeled filter paper cards (Grade 226, PerkinElmer), followed by ambient drying (20-25 °C, overnight). The dried samples were then packaged with desiccant packs and stored at 2-8 °C until analysis. The BTD level of each DBS sample was determined using the Trimaris Neonatal Fluorometric Biotinidase Kit (Bome-Trivitron, Türkiye) and was presented in Table I.
| Dried blood spot (DBS) samples were prepared from different blood pools (HCT34, HCT50, HCT50(-W)) of increasing biotinidase activity levels. Biotinidase activity was measured fluorometrically (Trimaris Neonatal Fluorometric Biotinidase Kit; n=12 per condition). Data are presented as mean fluorescence intensity ± standard deviation (% coefficient of variation). Measured biotinidase activity for all punches was calculated using a standard curve derived from the fluorescence intensities of central punches from HCT50 DBS samples. Statistical comparisons were performed using a t-test (significance threshold p < 0.05), with Cohen’s d values reported for effect size. Deviations exceeding 10% are highlighted. | ||||||||
| Table I. Effect of punch location on fluorescence intensity and measured biotinidase (BTD) activity in DBS samples over different blood-pools. | ||||||||
| Blood pool |
|
|
|
|||||
|
|
|
|
|
|||||
|
|
|
|
|
|
||||
| HCT34 |
|
|
|
|
|
|
|
|
| HCT34 |
|
|
|
|
|
|
|
|
| HCT34 |
|
|
|
|
|
|
|
|
| HCT34 |
|
|
|
|
|
|
|
|
| HCT50 |
|
|
|
|
|
|
|
|
| HCT50 |
|
|
|
|
|
|
|
|
| HCT50 |
|
|
|
|
|
|
|
|
| HCT50 |
|
|
|
|
|
|
|
|
| HCT50(-W) |
|
|
|
|
|
|
|
|
| HCT50(-W) |
|
|
|
|
|
|
|
|
| HCT50(-W) |
|
|
|
|
|
|
|
|
| HCT50(-W) |
|
|
|
|
|
|
|
|
Fluorometric biotinidase assay
Biotinidase activity measurements were performed from the DBS samples according to the method developed by Wastell et al., using the Trimaris Neonatal Fluorometric Biotinidase Kit (Bome-Trivitron, Türkiye) with a linear quantification range of 5-350 U.7 The assay was conducted in microplate format following the manufacturer’s protocol, with fluorescence measurements acquired using a microplate-compatible fluorometer (excitation: 360 nm; emission: 460 nm). In this study, the primary objective was to compare biotinidase measurements across different matrices in relative terms rather than to ascertain their true absolute values. Accordingly, the peak biotinidase level of the initial blood pool was not calibrated against the kit calibrator. Instead, it was arbitrarily assigned a value of 200 U. Since HCT levels in newborns are typically 50-55%, a blood pool with 50% HCT was designated as the reference. The starting blood pool with 50% HCT with peak biotinidase activity was assigned a value of 200 U. This pool was then serially diluted 1:1 with biotinidase-deficient (0 U) blood to create calibrators of 100 U and 50 U. Since the Trimaris Neonatal Fluorometric Biotinidase Kit (Bome-Trivitron, Türkiye) has a linear quantification range of 5–350 U, DBS materials prepared from these serially diluted blood pools (50% HCT), were used to establish a calibration curve. Subsequently, biotinidase activities of all DBS samples were determined against this reference.
Assessment of hematocrit effect
The HCT level of the donor whole blood unit obtained from the Turkish Red Crescent was measured as 34%. The unit was divided into two equal portions: a) the first blood pool was kept at 34% HCT, b) the HCT level of the second portion was adjusted to 50% as explained previously to simulate neonatal blood composition.11 (Briefly, the blood pool was centrifuged to separate RBC and serum fractions, and the supernatant serum was transferred into a fresh tube. To achieve the target HCT level, a calculated volume of autologous serum was gradually added back onto the packed cells. The HCT was verified using a Radim Seac HeCo automated analyzer [Radim Seac S.r.l., Pomezia, Italy] after each serum addition to ensure the exact HCT level. Blood pools of 34% HCT (HCT34) and 50% HCT (HCT50) with peak biotinidase activity (BTD-200U) were further used to prepare respective blood pools with varying biotinidase activities (BTD-0U, BTD-50U, and BTD-100U) as explained above.
Assessment of cellular interference
To investigate potential cellular interference from leukocyte-derived biotinidase in DBS-based assays, we prepared paired blood pools (with and without WBCs) at 50% hematocrit: HCT50 and HCT50(-W).11 The initial blood pool (HCT34) was centrifuged (3,000 rpm, 5 min, deceleration: 3) to separate cellular components and serum. After careful removal of the buffy coat via pipetting, the remaining constituents were gently resuspended to homogeneity, creating the “50% HCT (-WBC)” test group HCT50(-W).
Assessment of punch location effect
To evaluate chromatographic effects of punch location on biotinidase recovery, we performed fluorometric assays on DBS samples prepared from three blood pools: HCT34, HCT50, and HCT50(-W). We collected 3.2 mm punches from both central and peripheral locations of each DBS (n=12 per condition).
Statistical analysis
For each condition, biotinidase activity was measured in 12 distinct DBS samples (n=12) using the Trimaris Neonatal Fluorometric Biotinidase Kit. Paired central and peripheral punches were collected from the same DBS cards for positional comparisons. All data are expressed as mean fluorescence ± standard deviation (SD). Mean fluorescence values were used to calculate biotinidase activity recovery rates across different punch positions and conditions. Peripheral vs. center deviation ratios are presented as percentage differences between mean fluorescence values. For DBS-based measurements, the total allowable error (TAE) is generally accepted as 30%.15 Assuming this error budget is allocated equally between random (imprecision) and systematic (bias) errors, 15% is conventionally assigned to analytical processes related to assay precision, and 15% is reserved for systematic deviations inherent to the sample matrix. Sample-related deviations in DBS-based analysis can arise from various sources. Although numerous factors can cause pre-analytical variation, this study focused on three parameters: hematocrit variation, cellular interference, and punch location. Allocating a separate 15% budget for each potential source of pre-analytical variation would cause the cumulative error to far exceed the 30% TAE. Considering that these factors would have additive effects in real-world samples, a threshold of 10% was established for the clinical effect magnitude (i.e., the relative percentage difference in fluorescence signals required to be considered clinically significant). Statistical analysis was performed using Analyse-it software. For comparisons across all groups, a one-way ANOVA was applied, with significant outcomes further analyzed by Tukey’s honestly significant difference (HSD) post-hoc test. Pairwise comparisons between two conditions were conducted using an unpaired t-test. A p-value of less than 0.05 was considered statistically significant. Effect sizes for pairwise comparisons are reported as Cohen’s d. For DBS-based measurements, the TAE is set at 30%.15 Based on established error budgets, deviations greater than 15% were considered to represent a clinically significant effect size, as this value exceeds the expected analytical imprecision and indicates a potential pre-analytical or biological effect. To quantify the impact of variations in BTD activity measurements on clinical decision-making, the percentage difference in mean fluorescence intensity between compared samples was calculated, and is presented as the “Clinical Effect Magnitude” in Table I, Table II, and Table III.
| Dried blood spot (DBS) samples were prepared from blood pools with varying hematocrit (HCT34, HCT50) and increasing biotinidase activity levels. Biotinidase activity from central or peripheral punches was measured fluorometrically (Trimaris Neonatal Fluorometric Biotinidase Kit; n=12 per condition). Data are presented as mean fluorescence intensity ± standard deviation (% coefficient of variation). Measured biotinidase activity for all punches was calculated using a standard curve derived from the fluorescence intensities of central punches from HCT50 DBS samples. Statistical comparisons were performed using a t-test (significance threshold p < 0.05), with Cohen’s d values reported for effect size. Deviations exceeding 10% are highlighted. | ||||||||
| Table II. Effect of hematocrit level on fluorescence intensity and measured biotinidase activity in DBS samples. | ||||||||
| Blood pool |
|
|
|
|||||
|
|
|
|
|
|||||
|
|
|
|
|
|
||||
| Center |
|
|
|
|
|
|
|
|
| Center |
|
|
|
|
|
|
|
|
| Center |
|
|
|
|
|
|
|
|
| Center |
|
|
|
|
|
|
|
|
| Peripheral |
|
|
|
|
|
|
|
|
| Peripheral |
|
|
|
|
|
|
|
|
| Peripheral |
|
|
|
|
|
|
|
|
| Peripheral |
|
|
|
|
|
|
|
|
| Dried blood spot (DBS) samples were prepared from blood pools at 50% hematocrit with (HCT50) or without (HCT50(-W)) leukocytes, with varying biotinidase activity levels. Biotinidase activity was measured fluorometrically in central and peripheral punches (Trimaris Neonatal Fluorometric Biotinidase Kit; n = 12 per condition). Data are presented as mean fluorescence intensity ± standard deviation (% coefficient of variation). Measured biotinidase activity for all punches was calculated using a standard curve derived from the fluorescence intensities of central punches from HCT50 DBS samples. Statistical comparisons were performed using a t-test (significance threshold p < 0.05), with Cohen’s d values reported for effect size. Deviations exceeding 10% are highlighted. | ||||||||
| Table III. Effect of cellular interference of leukocytes on fluorescence intensity and measured biotinidase activity in dried blood spot samples. | ||||||||
| Blood pool |
|
|
effect magnitude |
|||||
|
|
|
|
|
|||||
|
|
|
|
|
|
||||
| Center |
|
|
|
|
|
|
|
|
| Center |
|
|
|
|
|
|
|
|
| Center |
|
|
|
|
|
|
|
|
| Center |
|
|
|
|
|
|
|
|
| Peripheral |
|
|
|
|
|
|
|
|
| Peripheral |
|
|
|
|
|
|
|
|
| Peripheral |
|
|
|
|
|
|
|
|
| Peripheral |
|
|
|
|
|
|
|
|
Results
In all samples containing serum biotinidase (regardless of the blood pool characteristics), the biotinidase activity measured from peripheral punches was statistically significantly higher than the activity measured from central punches (Fig. 1B-D; red dashes).
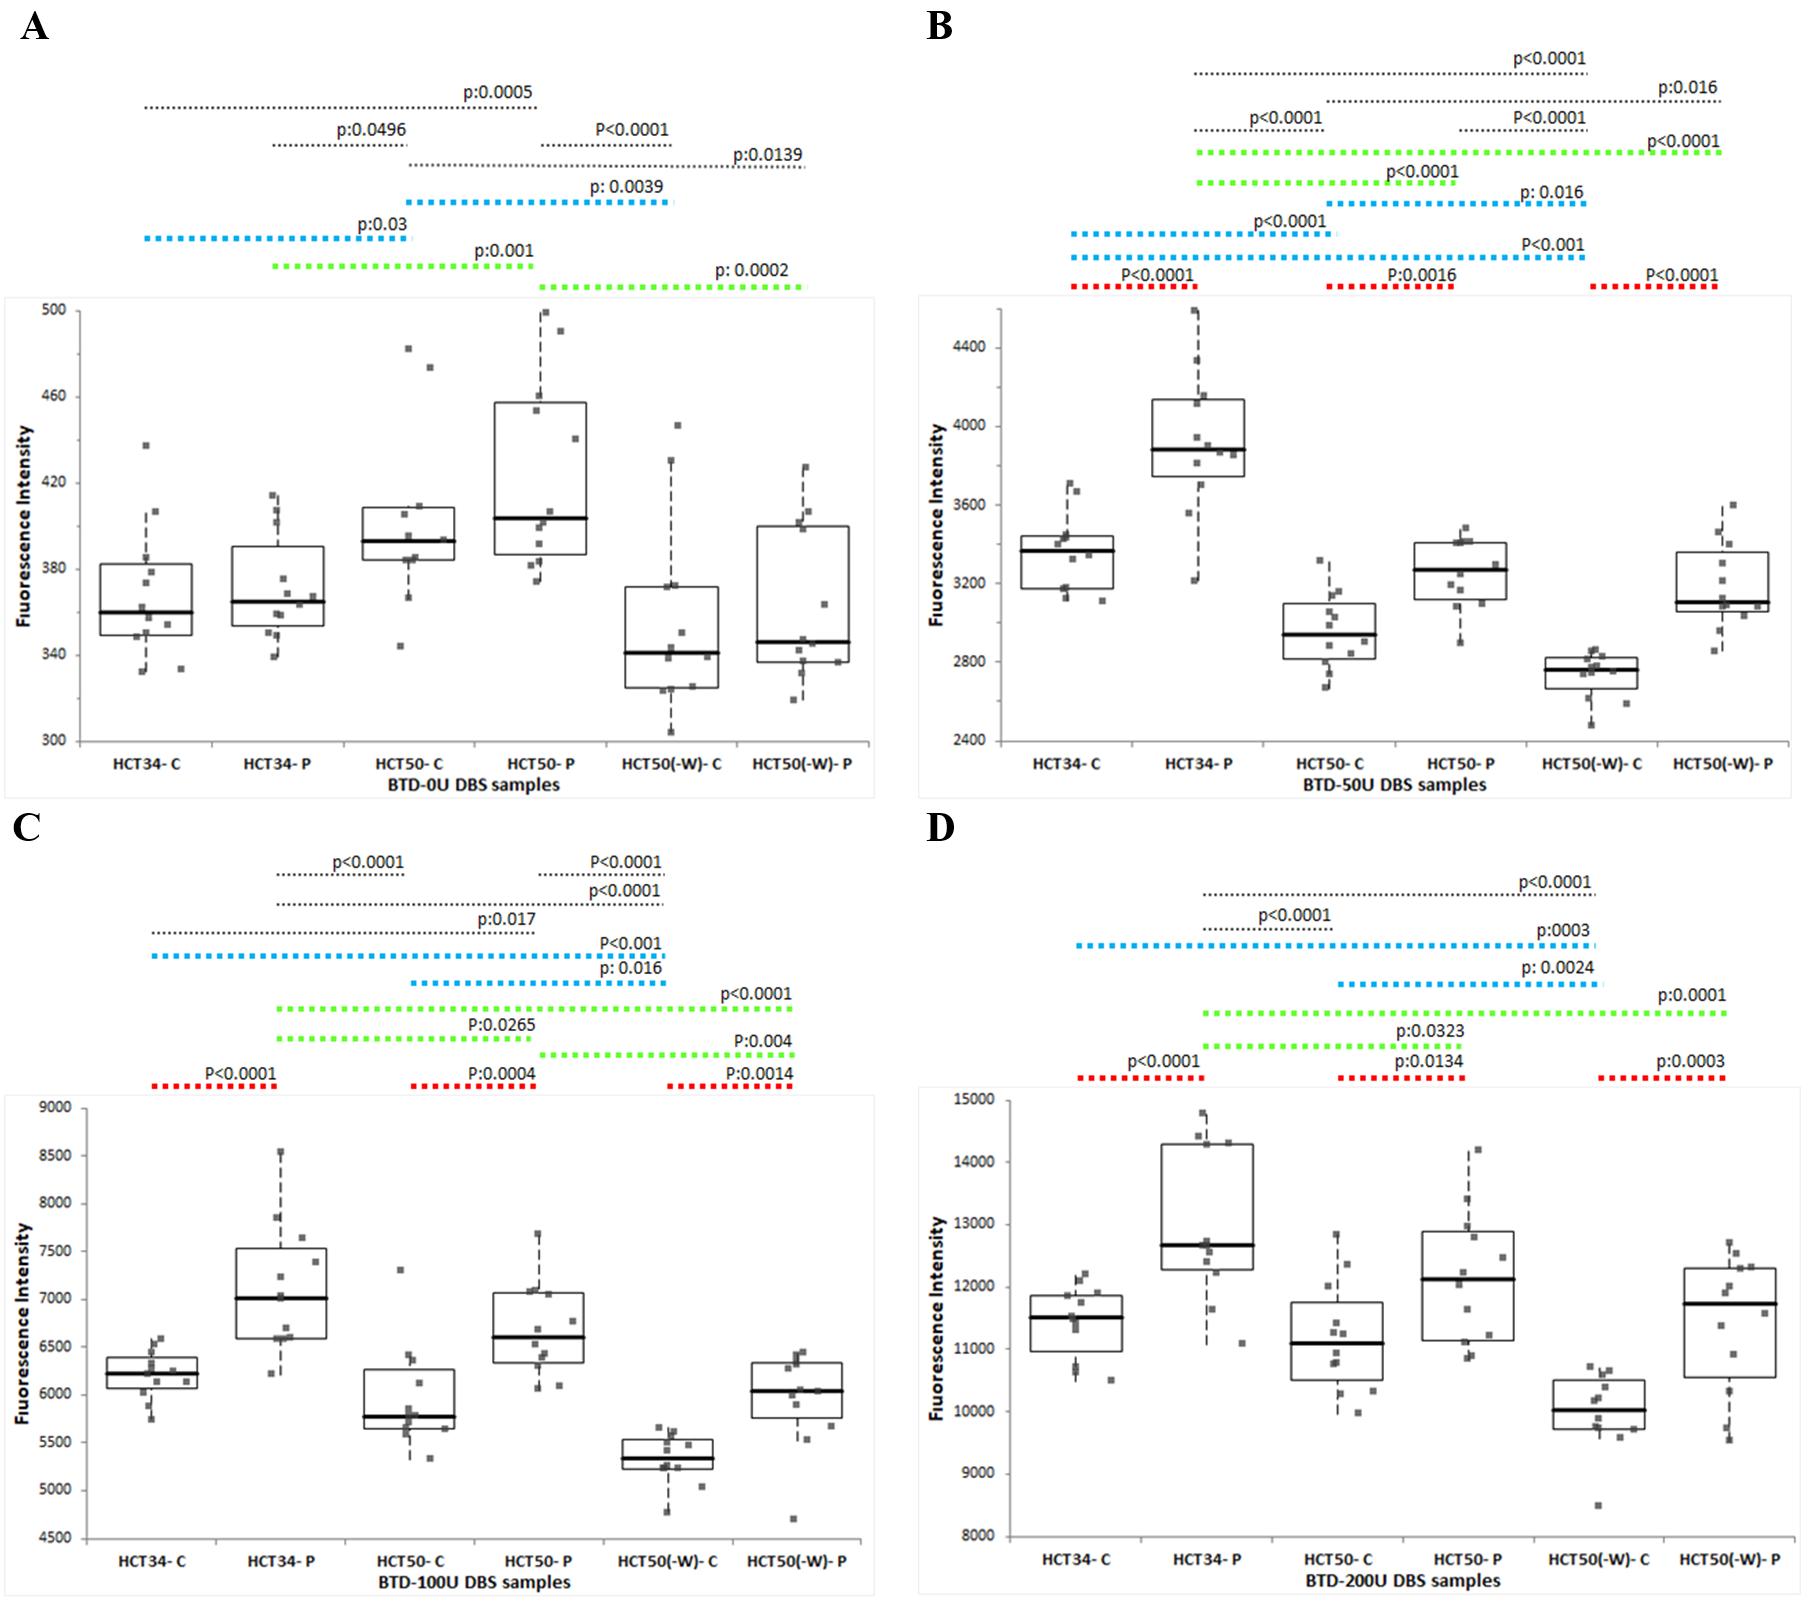
DBS: dried blood spot. HCT34: DBS samples prepared from blood pools having 34% hematocrit level. HCT50: DBS samples prepared from blood pools having 50% hematocrit level. HCT50(-W): DBS samples prepared from blood pools deficient of white blood cells (W) and having 50% hematocrit level. P: 3.2 mm punch taken from the peripheral location on the respective DBS. C: 3.2 mm punch taken from the central location on the respective DBS.
Furthermore, in peripheral punches, the biotinidase activity measured from DBS samples with a higher serum ratio (HCT34) was found to be statistically significantly higher than that from samples with a low serum ratio (HCT50) for all biotinidase containing levels (Fig. 1B-D; green dashes). Although a similar trend was observed in central punches, statistical significance was achieved only in BTD-50U samples, which are close to the clinical decision threshold (Fig. 1B; blue dashes).
In BTD-0U samples, an opposite effect was observed: the biotinidase activity signals obtained from both central and peripheral punches were statistically significantly higher in HCT50 samples compared to HCT34 samples. The biotinidase activities measured from leukocyte-depleted samples (HCT50(-W)) were lower than those from their whole blood counterparts at the same hematocrit level (HCT50) at all biotinidase levels (BTD-0U, BTD-50U, BTD-100U, and BTD-200U). This trend was visible across all punches; however, statistical significance was achieved for all biotinidase levels in central punches (Fig. 1A-D; blue dashes), but only at the BTD-0U and BTD-100U levels in peripheral punches (Fig. 1A, Fig. 1D; green dashes).
In both central and peripheral punches, biotinidase activity was significantly lower in leukocyte-depleted (HCT50(-W)) samples than in HCT34 samples (with a higher serum component) across all biotinidase -containing levels (Fig. 1A-D; blue and green dashes).
A standard curve derived from the fluorescence intensities of central punches from HCT50 DBS samples was used to calculate the biotinidase activity units for all samples. An assessment of analytical precision, based on repeated measurements of 12 samples, revealed that all % coefficient of variation (%CV) values fell within the 15% imprecision budget, at below 9.5%; the BTD-0U value was disregarded from the precision assessment as it fell below the limit of detection (LOD).
The fluorescence intensities measured from central punches were systematically lower than those from peripheral punches. This difference was both statistically (p<0.05) and clinically significant. The close similarity between the %CV values of repeated measurements from central punches (n=12) and peripheral punches (n=12) indicates that punch location does not significantly affect the repeatability (precision) of the assay. When the clinical effect magnitude—defined as the relative difference in fluorescence signals between central and peripheral punches of DBS samples prepared from different blood pools—was analyzed, the difference was found to be substantial across all samples. The magnitude of this effect, ranked from largest to smallest, was as follows: HCT34 (13.36–16.61%), HCT50(-W) (11.93–16.39%), and HCT50 (8.62–12.02%) (Table I).
A decrease in hematocrit levels consistently resulted in higher fluorescence intensities for biotinidase activity assessments. This effect was most pronounced in peripheral punches, where the difference between the fluorescence intensities of HCT34 and HCT50 samples was statistically significant across all biotinidase levels. In central punches, the difference in fluorescence intensities reached statistical significance at the BTD-0U and BTD-50U levels. When these fluorescence values were converted to biotinidase activity units, around the clinical decision limit (BTD-50U), the measured biotinidase activity was significantly higher in HCT34 samples than in HCT50 samples. This difference exceeded the 10% clinical significance threshold for both punch locations, with a substantial 20.30% increase in peripheral punches and a 13.56% increase in central punches (Table II).
Leukocyte-depleted samples consistently yielded lower fluorescence intensities for biotinidase activity assessments. This effect was most pronounced in central punches, where the difference between HCT50(-W) and HCT50 samples was statistically significant across all biotinidase levels. In peripheral punches, the difference in fluorescence intensities reached statistical significance at the BTD-0U and BTD-100U levels. Consequently, the calculated biotinidase activity was significantly lower in HCT50(-W) samples than in HCT50 samples. The difference was clinically significant (exceeded the 10% threshold) for central punches at the BTD-100U and BTD-200U levels (10.52% and 10.68%, respectively) and for peripheral punches at the BTD-100U level (10.61%) (Table III).
Discussion
Given that assay precision is paramount for accurate and reliable neonatal screening, managing the constrained TAE budget, set at 30% and equally divided between imprecision and bias for DBS-based assays like the biotinidase deficiency screening, becomes a critical endeavor.
To understand, address, and pave the way for mitigating the imprecision stemming from pre-analytical parameters in DBS-based BD screening, this study investigated the impact of key pre-analytical factors, namely, hematocrit variation, cellular interference, and punch location, on biotinidase activity measurements. The findings reported in this study reveal that even without considering other potential pre-analytical variables, these three parameters alone are sufficient to consume an error magnitude equivalent to the entire systematic error budget, which constitutes half of the total allowable error. To elaborate, 1) peripheral punches yielded higher biotinidase activity than central punches across all sample types (13.36%–16.61% difference, p<0.05); 2) lower hematocrit (HCT34) led to a significant overestimation of activity, yielding >20% higher values at the critical BTD-50U level; and 3) leukocyte depletion resulted in a statistically significant decrease in measured activity (~10.6%, p<0.05), indicating that approximately 10% of the quantified activity in DBS is leukocyte-derived.
The rapid colorimetric method employing biotin-4-amidobenzoic acid, which was developed in 1984 for the semiquantitative assessment of biotinidase activity in DBS, soon started to be used in high-throughput neonatal screening programs worldwide.3-5 The later-developed fluorescent technique, which utilizes biotinyl-6-aminoquinoline as a substrate (and was subsequently optimized for an ultramicroassay format), offers enhanced clinical sensitivity and specificity for dried blood spot analysis, outperforming the colorimetric method.7-9 Molecular genetic testing of the BTD gene, ranging from targeted variant analysis to complete sequencing, provides diagnostic confirmation.1
A 1998 pilot study demonstrated that the incidence of BD in Türkiye (1:11,614) was significantly higher than reported in other countries, with profound and partial BD occurring at rates of 1:14,866 and 1:53,093, respectively.16 Marked regional variations were observed, particularly in consanguineous populations, where incidence reached 1:2,359 in Diyarbakır and 1:481 in Adıyaman.13,17 Further analysis of a 2016–2023 Van cohort revealed parental consanguinity in 44.7% of cases and a positive family history of BD in 24.6% of patients.2 BD screening was added as a parameter to the Turkish National Screening Program in 2008.2 The program which initially employed a colorimetric assay for quantification of biotinidase activity, transitioned to a fluorometric assay in 2015.
It is well-established that sample-related variation is a significant challenge in neonatal screening assays utilizing DBS. When these systematic deviations occur near the clinical decision limit, they can lead to false-negative results and missed cases. To minimize this sample-induced bias and enhance clinical sensitivity, it is crucial to first decipher the sources of pre-analytical variation. Previous studies have unveiled the causes of sample-related pre-analytical variation for immunoassays (e.g., TSH, IRT) and MS-based quantifications (e.g., amino acids, acylcarnitines).18 However, to date, a similar comprehensive study has not been conducted for biotinidase deficiency screening via enzymatic activity quantification. In Türkiye, approximately 1.2 million babies are born each year, and the incidence of BD is relatively high due to the high prevalence of consanguineous marriages.2,13,14,17 To enhance the clinical sensitivity of neonatal screening programs for BD in Türkiye and beyond, this study aims to unveil the sources of pre-analytical variation by investigating the effects of key parameters—hematocrit level, punch location, and cellular interference—on the fluorometric biotinidase assay.
Our results demonstrated that, regardless of the blood pool characteristics (hematocrit, leukocyte content) investigated, biotinidase measurements from punches taken from the periphery of DBS were significantly higher than those from the center. The phenomenon of central punches yielding lower results than peripheral ones has been documented for other neonatal screening parameters.11,19,20 This discrepancy can be explained by the faster diffusion rate of the serum component through the filter paper matrix compared to the cellular component. To prevent misinterpretations arising from punch location, we recommend that both calibrators and punches from infant heel-prick blood samples be taken from the center of the DBS.
Although reference values for neonatal blood hematocrit levels are accepted as 50-55%, significant variations can occur depending on the infant’s overall health. Pioneering studies examining the effect of hematocrit on the diffusion rates of serum and cellular components on filter paper—and consequently on analyte measurements—have shown that as hematocrit increases, the serum ratio in central punches decreases while the cellular ratio increases.11,21 In this context, it has been reported that with increasing hematocrit, measured levels of TSH, octanoyl carnitine, and methionine from central punches decrease, while IRT measurements at HCT levels above 50% are higher.19 In the fluorometric biotinidase measurements, it is observed that the biotinidase activity measured from low-hematocrit (HCT34) DBS samples was higher than that from high-hematocrit (HCT50) samples, in both central and peripheral punches. Although this elevation was observed at all biotinidase levels, the clinically relevant overestimation in HCT34 DBS became most apparent at the BTD-0U and BTD-50U levels. The fact that the magnitude of this bias is more pronounced near the clinical decision threshold than at higher biotinidase levels indicates that screening results, particularly those near the cutoff, may vary depending on hematocrit levels. To prevent false negatives in newborn screening, it may be beneficial to re-evaluate infants with biotinidase enzyme activity close to the clinical decision limit, taking their blood hematocrit percentage into account. Future studies should evaluate whether different clinical decision thresholds should be applied for different hematocrit levels.
The biotinidase enzyme, primarily synthesized in the liver, demonstrates its highest activity levels in serum.1 While current diagnostic standards for BD employ serum-based activity assays (which serve as both primary diagnostic and second-tier confirmatory tests), documented expression in fibroblasts and leukocytes raises critical questions about potential cellular interference in DBS analyses, particularly given the known interindividual variability in leukocyte counts. In our cellular interference study, we observed that biotinidase measurements from leukocyte-depleted DBS were significantly lower, with a difference exceeding the 10% bias budget allocated for such variations. Considering that BTD-0U samples were serum-replaced, the higher signal obtained from HCT50 samples (with a higher packed-cell volume) compared to HCT34 samples strongly suggests that the biotinidase activity measured in BTD-0U samples is likely of cellular origin. This hypothesis is further supported by the results from leukocyte-depleted HCT50(-W) samples, in which calculated biotinidase activity was significantly lower in HCT50(-W) samples than in HCT50 samples. These results indicate that the biotinidase activity quantified from DBS is not solely serum-derived; approximately 10% originates from leukocytes. Given that screening kit calibrators are prepared with blood from healthy individuals with average cell counts, we recommend that second-tier BTD activity results be interpreted in conjunction with the infant’s complete blood count (CBC) to avoid misinterpretation.
Due to the high volume of blood required, the DBS samples tested in this study were prepared from a donated adult blood unit. While it is not feasible to create an experimental setup for testing HCT and WBC differences with neonatal blood, future studies could directly assess the impact of peripheral versus central punching on BTD measurements in newborn screening by utilizing a larger number of DBS cards (e.g., >20) from infants with BTD levels close to the clinical cutoff, which would be highly valuable for understanding these effects at pathological levels.
In conclusion, our findings underscore the critical impact of pre-analytical variables—specifically hematocrit, punch location, and cellular interference—on the reliability of fluorometric biotinidase activity measurements. As biotinidase activity can vary even when samples are obtained from the same individual but tested in different laboratories, standardization of the testing procedures is required to improve precision. The integration of the above-mentioned factors into routine practice and data interpretation will enhance the accuracy and clinical sensitivity of newborn screening for biotinidase deficiency. Given the variability of enzyme activity, particularly in suspected biotinidase deficiency, molecular genetic analysis should always be performed for confirmation or exclusion of the diagnosis.
Acknowledgements
The author would like to extend her sincere gratitude to Bome Trivitron Sanayi Ürünleri Dış Ticaret AŞ, for sponsoring this study and generously providing the assay kits. Their unwavering support and commitment to advancing the quality of newborn screening were instrumental in facilitating this research. She also wishes to specifically thank the Quality Control Team at BOME Trivitron for their exceptional technical support and collaboration throughout the project. The author is deeply grateful to Prof. Muhittin Abdülkadir Serdar for his invaluable statistical guidance and expert support in the data analysis, which were fundamental to the integrity of this study.
Ethical approval
This study did not require ethical approval as it utilized anonymized residual blood samples originally collected for quality control material production. The study involved no direct contact with human subjects.
Source of funding
The study is supported and funded by Bome Trivitron Sanayi Ürünleri Dış Ticaret AŞ.
Conflict of interest
CCS worked as the R&D manager for Bome Trivitron Sanayi Ürünleri Dış Ticaret AŞ between 2012-2017.
References
- Strovel ET, Cowan TM, Scott AI, Wolf B. Laboratory diagnosis of biotinidase deficiency, 2017 update: a technical standard and guideline of the American College of Medical Genetics and Genomics. Genet Med 2017; 19: 10.1038/gim.2017.84. https://doi.org/10.1038/gim.2017.84
- Çıkı K, Alavanda C, Ceylan Eİ, Tanyalçın T, Kılavuz S. Comprehensive analysis of genotypic and phenotypic characteristics of biotinidase deficiency patients in the eastern region of Türkiye. Turk J Pediatr 2024; 66: 608-617. https://doi.org/10.24953/turkjpediatr.2024.5075
- Wolf B, Grier RE, Allen RJ, Goodman SI, Kien CL. Biotinidase deficiency: the enzymatic defect in late-onset multiple carboxylase deficiency. Clin Chim Acta 1983; 131: 273-281. https://doi.org/10.1016/0009-8981(83)90096-7
- Heard GS, Secor McVoy JR, Wolf B. A screening method for biotinidase deficiency in newborns. Clin Chem 1984; 30: 125-127.
- Wolf B, Heard GS, Jefferson LG, et al. Neonatal screening for biotinidase deficiency: an update. J Inherit Metab Dis 1986; 9(Suppl 2): 303-306. https://doi.org/10.1007/978-94-009-4131-1_55
- Wolf B. Worldwide survey of neonatal screening for biotinidase deficiency. J Inherit Metab Dis 1991; 14: 923-927. https://doi.org/10.1007/BF01800475
- Wastell H, Dale G, Bartlett K. A sensitive fluorimetric rate assay for biotinidase using a new derivative of biotin, biotinyl-6-aminoquinoline. Anal Biochem 1984; 140: 69-73. https://doi.org/10.1016/0003-2697(84)90134-9
- Broda E, Baumgartner ER, Scholl S, Stopsack M, Horn A, Rhode H. Biotinidase determination in serum and dried blood spots--high sensitivity fluorimetric ultramicro-assay. Clin Chim Acta 2001; 314: 175-185. https://doi.org/10.1016/s0009-8981(01)00690-8
- Işeri-Erten SÖ, Dikmen ZG, Ulusu NN. Comparison of spectrophotometric and fluorimetric methods in evaluation of biotinidase deficiency. J Med Biochem 2016; 35: 123-129. https://doi.org/10.1515/jomb-2016-0004
- Wolf B. Biotinidase deficiency. 2000 Mar 24 [Updated 2023 May 25]. In: Adam MP, Bick S, Mirzaa GM, et al., editors. GeneReviews® [Internet]. Seattle (WA): University of Washington, Seattle; 1993-2026. Available at: https://www.ncbi.nlm.nih.gov/books/NBK1322/
- Hall EM, Flores SR, De Jesús VR. Influence of hematocrit and total-spot volume on performance characteristics of dried blood spots for newborn screening. Int J Neonatal Screen 2015; 1: 69-78. https://doi.org/10.3390/ijns1020069
- Moat SJ, Dibden C, Tetlow L, et al. Effect of blood volume on analytical bias in dried blood spots prepared for newborn screening external quality assurance. Bioanalysis 2020; 12: 99-109. https://doi.org/10.4155/bio-2019-0201
- Küçükkelepçe O, Konyalıoğlu FS, Kurt O. Incidence analysis of six diseases in the national newborn screening program: a retrospective study from Adıyaman, Turkiye (2019-2023). Anatol Curr Med J 2024; 6: 361-366. https://doi.org/10.38053/acmj.1532044
- Fidan Ç, Örün H, Alper AB, et al. Expanded newborn bloodspot screening: developed country examples and what can be done in Turkey. Intractable Rare Dis Res 2022; 11: 63-69. https://doi.org/10.5582/irdr.2022.01039
- Lehotay DC, Hall P, Lepage J, Eichhorst JC, Etter ML, Greenberg CR. LC-MS/MS progress in newborn screening. Clin Biochem 2011; 44: 21-31. https://doi.org/10.1016/j.clinbiochem.2010.08.007
- Baykal T, Hüner G, Sarbat G, Demirkol M. Incidence of biotinidase deficiency in Turkish newborns. Acta Paediatr 1998; 87: 1102-1103. https://doi.org/10.1080/080352598750031518
- Toktaş İ, Sarıbaş S, Canpolat S, Erdem Ö, Özbek MN. Evaluation of patients diagnosed with phenylketonuria and biotinidase deficiency by the newborn screening program: a ten-year retrospective study. Turk J Pediatr 2022; 64: 985-992. https://doi.org/10.24953/turkjped.2022.467
- Raveendran A, Gupta A, Lewis LE, Prabhu K, Moorkoth S. A comprehensive approach for detection of biotin deficiency from dried blood spot samples using liquid chromatography-mass spectrometry. Future Sci OA 2024; 10: 2355038. https://doi.org/10.1080/20565623.2024.2355038
- Lawson AJ, Bernstone L, Hall SK. Newborn screening blood spot analysis in the UK: influence of spot size, punch location and haematocrit. J Med Screen 2016; 23: 7-16. https://doi.org/10.1177/0969141315593571
- Holub M, Tuschl K, Ratschmann R, et al. Influence of hematocrit and localisation of punch in dried blood spots on levels of amino acids and acylcarnitines measured by tandem mass spectrometry. Clin Chim Acta 2006; 373: 27-31. https://doi.org/10.1016/j.cca.2006.04.013
- Mei JV, Alexander JR, Adam BW, Hannon WH. Use of filter paper for the collection and analysis of human whole blood specimens. J Nutr 2001; 131: 1631S-1636S. https://doi.org/10.1093/jn/131.5.1631S
Copyright and license
Copyright © 2026 The Author(s). This is an open access article distributed under the Creative Commons Attribution License (CC BY), which permits unrestricted use, distribution, and reproduction in any medium or format, provided the original work is properly cited.