Abstract
Background. The arterial wall tends to stiffen owing to prolonged exposure to cardiovascular disease risk factors such as high blood pressure, hyperglycemia, and chronic inflammation. Epidemiological research has demonstrated that maternal factors, demographic characteristics, and clinical data influence arterial stiffness and echocardiographic findings. This study aimed to evaluate the association between arterial stiffness and echocardiographic findings with maternal factors and demographic and clinical characteristics in infants of mothers with gestational diabetes or hypertension during the neonatal period.
Methods. A total of 67 newborns between 12-29 days of age, including 15 neonates of hypertensive mothers, 26 neonates of diabetic mothers, and 26 neonates in the control group, were included. Carotid-femoral pulse wave velocity (cfPWV) was used as a marker of arterial stiffness and measurements were performed using echocardiography. Basic echocardiographic evaluations and atrial and ventricular strain assessments were performed.
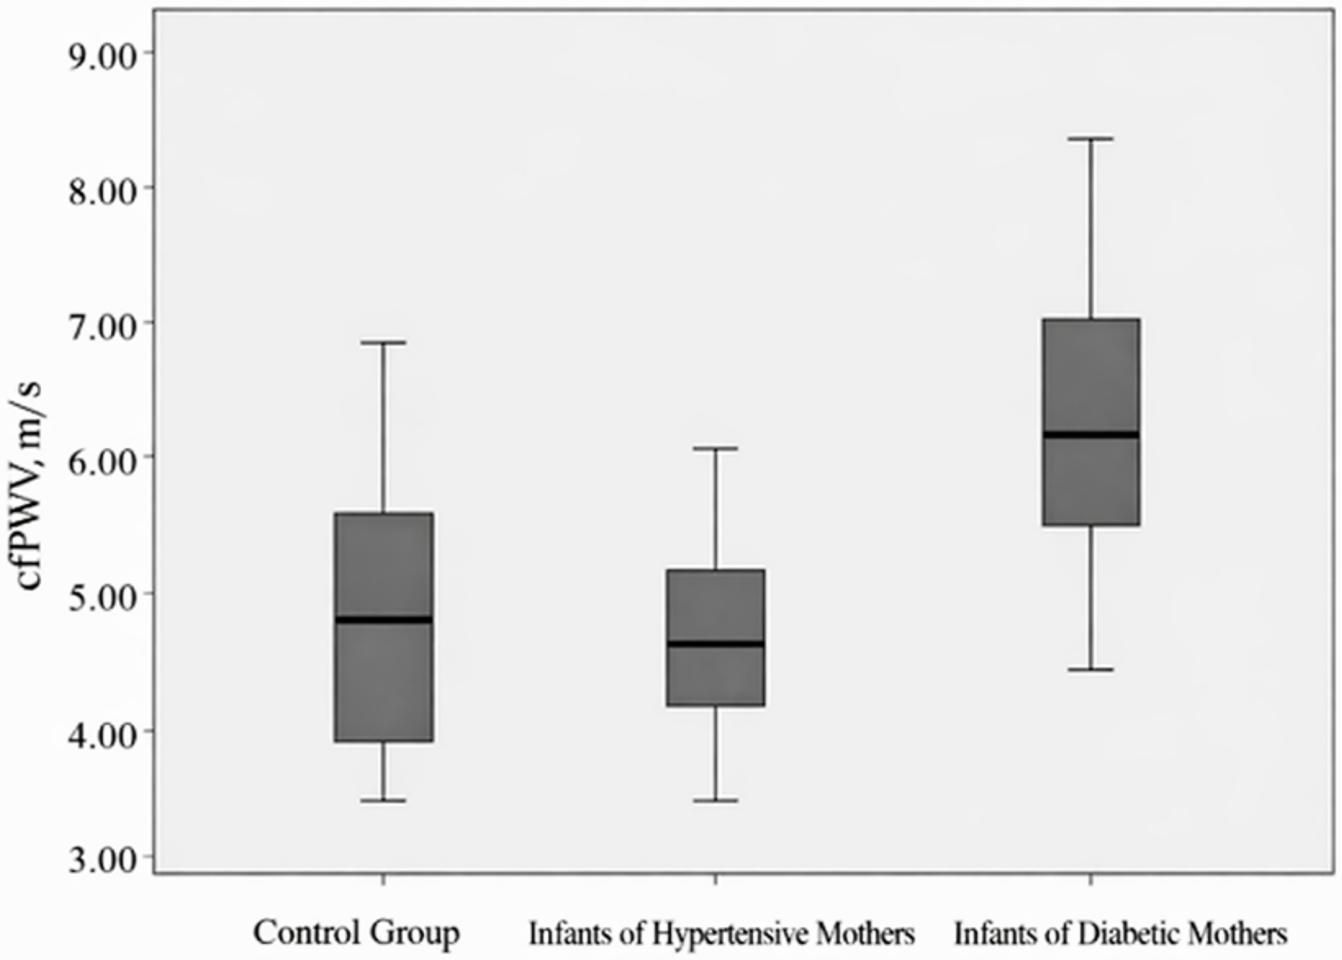
Results. The mean cfPWV value of infants of diabetic mothers (6.34 m/s) was significantly higher than that of infants of hypertensive mothers (4.65 m/s) and the control group (4.56 m/s) (p<0.001). Multivariate linear regression analysis revealed that increasing maternal age and the presence of diabetes in the mother were predictors of carotid-femoral pulse wave velocity values. The right ventricular free wall longitudinal strain z-scores were higher in hypertensive infants, while no significant difference was found in other strain measurements.
Conclusion. The analysis of arterial stiffness in infants of diabetic mothers, infants of hypertensive mothers, and controls showed that advanced maternal age and maternal diabetes were particularly associated with increased cfPWV. This study highlights the potential influence of maternal metabolic status on neonatal cardiac morphology and vascular function. Based on the data presented, further research is warranted to investigate whether the observed effects on arterial stiffness in infants of diabetic mothers persist into older ages and have long-term implications for the health of these patients.
Keywords: neonates, gestational diabetes mellitus (GDM), gestational hypertension, arterial stiffness, strain echocardiography, relative wall thickness
Introduction
Arterial stiffness reflects the mechanical properties of the vascular wall and is commonly expressed as the elastic modulus. As arterial pressure and diameter increase, circumferential wall stress is gradually transferred from extensible elastin fibers to relatively inextensible collagen fibers, resulting in progressive stiffening of the arterial wall.1,2 Exposure to cardiovascular risk factors, including hypertension, hyperglycemia, dyslipidemia, and inflammation, accelerates this process and leads to early vascular remodeling.3,4
Pulse wave velocity (PWV) measured in central arterial segments is accepted as the gold standard for the assessment of arterial stiffness.5 In adults, aortic pulse wave velocity (aPWV) is a strong independent predictor of cardiovascular mortality and has been shown to outperform conventional parameters such as systolic blood pressure and pulse pressure.6,7 Increasing evidence suggests that the origins of cardiovascular disease begin early in life. Elevated blood pressure becomes clinically detectable in childhood when values exceed the 90th percentile for age8, and increased aPWV predicts the later development of hypertension. Importantly, increased PWV in the neonatal period has also been associated with future cardiovascular disease and target-organ damage.9
The concept of fetal programming proposes that intrauterine conditions influence cardiovascular structure and function in later life. Maternal characteristics, perinatal factors, and neonatal clinical parameters have been shown to affect vascular function and arterial stiffness.9-12 However, vascular changes do not occur in isolation; they are closely linked to cardiac performance. Increased arterial stiffness leads to elevated left ventricular afterload, which may result in subtle alterations in myocardial mechanics even before conventional echocardiographic parameters become abnormal.13
Advanced echocardiographic techniques, particularly speckle-tracking echocardiography, allow the evaluation of myocardial deformation and provide a sensitive assessment of cardiac function. Strain and strain-rate parameters can detect subclinical myocardial dysfunction earlier than traditional measurements such as ejection fraction. Therefore, the simultaneous assessment of arterial stiffness and myocardial deformation may improve the understanding of early cardiovascular adaptation in the neonatal period.14,15
In this study, we aimed to investigate the relationship between aortic pulse wave velocity and echocardiographic parameters, including myocardial strain measurements, and to evaluate their association with maternal factors and with the demographic and clinical characteristics of newborns.
Methods
Patient selection
This study was approved by the Hacettepe University Non-Interventional Clinical Research Ethics Committee (Date: 20 September 2022, Project No: GO 22/887, Decision No: 2022/18–34). Informed consent was obtained from the families for study participation. Healthy newborns aged 12-29 days, evaluated at the Department of Pediatric Cardiology, Hacettepe University between November 2022 and April 2023, were divided into three groups: infants of mothers with diabetes or hypertension, and infants of healthy mothers. Children with neurologic disease, coagulopathy, malignancy, renal and hepatic failure, heart disease or genetic disease were excluded. The mothers were followed-up by Hacettepe University Department of Obstetrics and Gynecology during the antenatal period. Diagnoses of gestational diabetes mellitus, pre-gestational diabetes mellitus, gestational hypertension and preeclampsia were determined according to international standards.16,17
Sex, birth weight, current weight, gestational age, delivery mode, echocardiographic findings, number of births, age, hypertension status, diabetes mellitus, HbA1c value, body mass index (BMI) calculated from prenatal weight and final prenatal hemoglobin value of mothers were recorded.
Echocardiographic measurements were performed in accordance with the American Society of Echocardiography standards18 using a Philips Healthcare EPIQ CVx (Philips Medical Systems, Andover, MA, USA) equipped with a Philips S9-2 (PureWave sector array transducer) probe. For standard echocardiographic measurements, parasternal long-axis (PSLAX) M-Mode, apical four-chamber (A4C), apical three-chamber (A3C) and apical 2-chamber (A2C) images were obtained. The left ventricular end-diastolic diameter (LVEDD), interventricular septum end-diastolic diameter (IVSd) and left ventricular posterior wall thickness (PWd) were recorded. The left ventricular mass (LVM), LVM index (LVMI) and relative wall thickness (RWT) values were calculated from these values. Doppler recordings of the aortic isthmus were obtained from the suprasternal notch and Doppler recordings of the femoral artery were obtained from the right femoral artery. Left ventricular, right ventricular and left atrial strain values of the patients were calculated and recorded using the Philips Healthcare EPIQ CVx system software. Image windows for which the optimal strain values could not be obtained from the recorded images were excluded from the calculation. The left ventricular global longitudinal peak strain (LV GLPS), right ventricular free wall longitudinal strain (RVFW LS), global longitudinal peak strain (RV GLPS), left atrial reservoir strain (LArS), conduit strain (LAconS) and contraction strain (LAcS) values were recorded.
LVM and LVMI were calculated using the following formulas:
There are two methods for measuring the RWT:
In our study, the second method was preferred because IVSd values were different between the groups, and it is known that IVSd values are high in infants of diabetic mothers.19
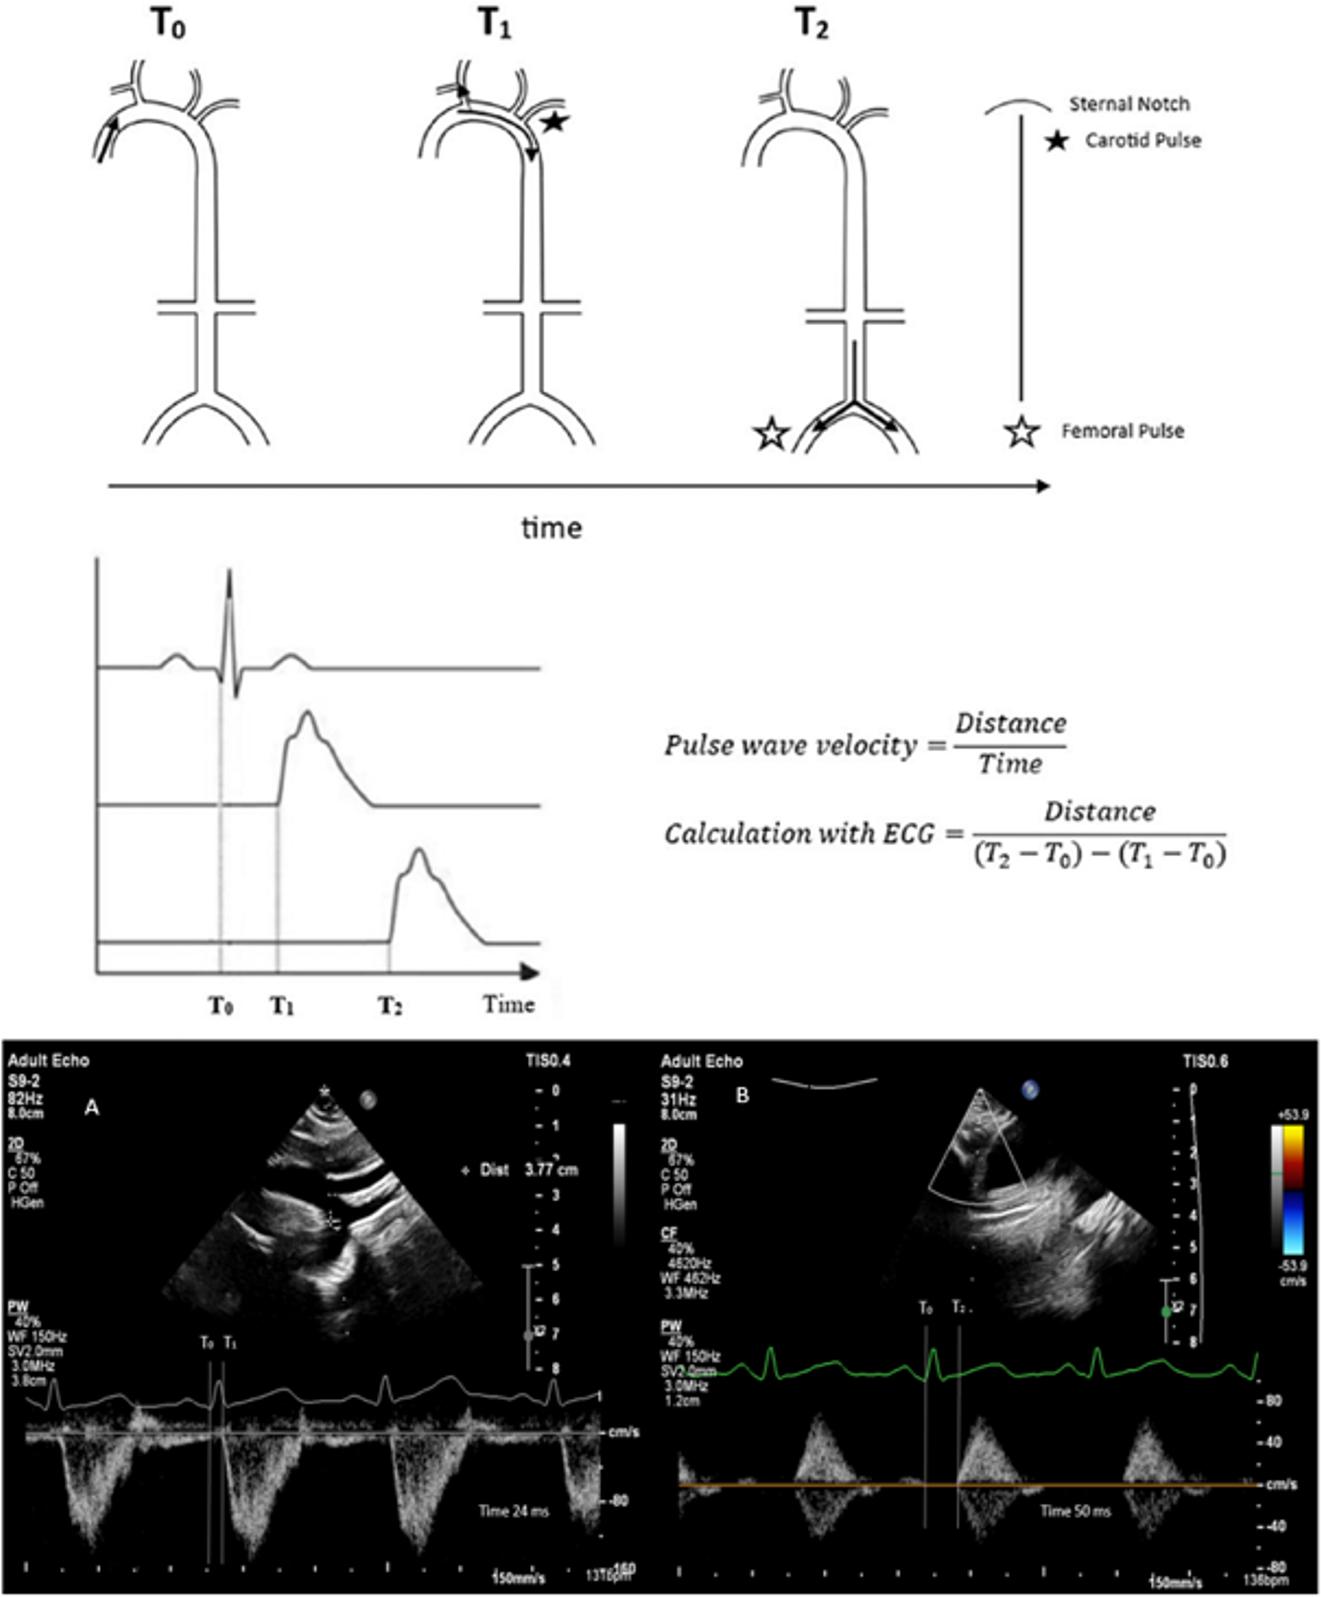
PWV measurements were performed between 14.00 and 17.00 hours in a temperature-controlled room using the same device. Measurements were taken when infants were at their calmest, with calculations performed three times. The calculation involved taking pulse waves and simultaneous ECG images from the sternal notch and femoral artery. The pulse wave was measured on the descending aorta from the sternal notch, and the distance from notch to measurement site was calculated. Then, the femoral artery pulse wave was measured, and the distance between sternal notch and femoral artery measurement site was measured. The distance (d) was calculated by subtracting the sternal notch-to-aorta distance from the sternal notch-to-femoral artery distance. The time to pulse wave onset was calculated from the QRS waves on ECG. The carotid-femoral pulse wave velocity (cfPWV) was obtained by dividing distance (d) by the difference between the QRS-to-femoral and QRS-to-aorta pulse wave times (Fig. 1).
Statistical analysis
Statistical analysis was performed using SPSS 22.0 (Statistical Package for the Social Sciences) software. The Kolmogorov–Smirnov test or Shapiro–Wilk test was used to determine whether the data were normally distributed. In the evaluation of the data, frequencies and percentages were given for qualitative data, arithmetic means and standard deviations were used for quantitative data, and median and minimum-maximum values were given for non-normally distributed data. The chi-square test or Fisher’s exact test was used for the comparison of categorical data, whereas Student’s t-test was used for the comparison of quantitative data between two groups with normally distributed data. One-way ANOVA was used for normally distributed data consisting of three groups, and the Kruskal-Wallis test was used for non-normally distributed data. The relationship between continuous data was evaluated using Pearson correlation analysis for normally distributed data and Spearman correlation analysis for non-normally distributed data. The receiver operating characteristic (ROC) curve analysis was applied to determine the cut-off value for cfPWV in infants of hypertensive and diabetic mothers. Univariate and multivariate linear regression analyses were applied to identify the factors affecting cfPWV. All statistical calculations were evaluated at a 95% confidence interval and a significance level of p < 0.05.
Results
A total of 67 infants were evaluated, and all had adequate echocardiographic and Doppler measurements. Therefore, all 67 infants (26 infants of diabetic mothers, 15 infants of hypertensive mothers, and 26 control infants) were included in the final analysis. The general characteristics of the infants and their mothers are presented in Table I.
| BMI: body mass index, C/S: Cesarean section, DM: diabetes mellitus, IVF: in vitro fertilization, NSVD: Normal spontaneous vaginal delivery, SD: standard deviation. | |
| Table I. General characteristics of the infants and mothers included in the study. | |
|
or n (%) |
|
| Infant | |
| Age, day |
|
| Sex | |
| Male |
|
| Female |
|
| Birth weight, gr |
|
| Gestational age at birth, wk |
|
| Method of birth | |
| C/S |
|
| NSVD |
|
| IVF |
|
| Mother | |
| Age, year |
|
| BMI, kg/m2 |
|
| Parity |
|
| Hemoglobin, gr/dL |
|
| HbA1c, % |
|
| Additional diseases | |
| Preeclampsia |
|
| Hypertension |
|
| Pre-gestational DM |
|
| Gestational DM |
|
The results of the comparison of infants of hypertensive mothers, infants of diabetic mothers and the control group in terms of maternal and infant demographic characteristics are presented in Table II. Compared to the control group, infants of diabetic and hypertensive mothers were born earlier and cesarean sections were significantly more frequent in these groups (p = 0.001 and p = 0.002, respectively). The age of mothers in the diabetic mother group was higher than in the other groups (p=0.005).
|
Continuous data showing normal distribution were expressed with arithmetic mean±SD; continuous data that did not show normal distribution with median (min-max), and categorical data with number (percentage). Continuous data were compared with one way ANOVA test or Kruskal-wallis test, while categorical data were compared with chi-square or Fisher exact test. aSignificant difference between infant of control and hypertensive mother group, bSignificant difference between infant of control and diabetic mother group, cSignificant difference between infant of hypertensive mother and diabetic mother group BMI: body mass index, C/S: cesarean section, Hgb: hemoglobin, IVF: in vitro fertilization, NSVD: Normal spontaneous vaginal delivery, SD: standard deviation |
||||
| Table II. Comparison results of infants and mothers between groups in terms of demographic characteristics. | ||||
|
|
|
|
p | |
| Infant | ||||
| Age, day |
|
|
|
0.382 |
| Sex | 0.638 | |||
| Male |
|
|
|
|
| Female |
|
|
|
|
| Birth weight, g |
|
|
|
0.483 |
| Gestational age at birth, wk |
|
|
|
0.001a,b |
| Method of birth | 0.002a, b | |||
| C/S |
|
|
|
|
| NSVD |
|
|
|
|
| IVF |
|
|
|
0.659 |
| Mother | ||||
| Age, yr |
|
|
|
0.005b,c |
| BMI, kg/m2 |
|
|
|
0.198 |
| Parity |
|
|
|
0.678 |
| Hgb, g/dL |
|
|
|
0.410 |
| HbA1c, % |
|
|
|
0.025a,b |
The results of the comparison of echocardiographic characteristics of infants of hypertensive mothers, infants of diabetic mothers and infants in the control group are given in Table III. The cfPWV values of the infants of diabetic mothers were found to be significantly higher than those of the other groups (p<0.001), whereas the cfPWV values of the infants of hypertensive mothers were similar to those of the control group (Fig. 2). The right ventricular free wall longitudinal strain values were more negative in hypertensive infants than in the control group. Both hypertensive and diabetic infants had higher IVSd values than the control group. (p=0.01) RWT values of the infants of diabetic mothers were generally higher than those of the other groups; however, this difference was statistically significant only when compared with the control group (p=0.015). There was no difference between the groups in atrial strain echocardiographic evaluation data.
|
Continuous data showing normal distribution were expressed with arithmetic mean±SD; and continuous data that did not show normal distribution with median (min-max. Continuous data were compared with one way ANOVA test or Kruskal-wallis test. aSignificant difference between infant of control and hypertensive mother group, bSignificant difference between infant of control and diabetic mother group, cSignificant difference between infant of hypertensive mother and diabetic mother group. cfPWV: carotid-femoral pulse wave velocity, IVSd: interventricular septum thickness, LA: left atrium, LV GLPS, left ventricular global longitudinal peak strain, LVM: Left ventricular mass, LVMI: Left ventricular mass index, RV: right ventricle, RWT: Relative wall thickness. |
||||
| Table III. Comparison results of the infants between the groups in terms of echocardiographic features. | ||||
|
|
|
|
|
|
| cfPWV, m/s |
|
|
|
|
| LV GLPS, % |
|
|
|
|
| RV free wall strain longitudinal, % |
|
|
|
|
| RV global longitudinal peak strain, % |
|
|
|
|
| LA reservoir strain, % |
|
|
|
|
| LA conduct strain, % |
|
|
|
|
| LA contraction strain, % |
|
|
|
|
| IVSd, mm |
|
|
|
|
| LVM, gram |
|
|
|
|
| LVMI, gr/m2 |
|
|
|
|
| RWT |
|
|
|
|
Univariate and multivariate linear regression analyses were performed to determine the factors affecting cfPWV values of the 67 infants included in the study and the results are presented in Table IV. Regression analyses were conducted to evaluate the relationship between maternal, obstetric, and neonatal factors and the outcome variable. In the univariate linear regression analysis, maternal age (β=0.299, p=0.014), neonatal sex (β=0.342, p=0.005), and maternal diabetes (β=0.664, p<0.001) were significantly associated with the outcome. Maternal BMI (p=0.066) and mode of delivery (p=0.078) demonstrated borderline associations. Other variables, including parity, birth weight, maternal hemoglobin level, conception via in vitro fertilization (IVF pregnancy), HbA1c level, and maternal hypertension were not significantly associated with the outcome. Variables with p<0.25 in the univariate linear regression analysis were included in the multivariate linear regression analysis.
|
Multivariate linear regression; R=0.797, R2=0.635, Adjusted R2=0.543. BMI: body mass index, IVF: in vitro fertilizasyon, NSVD: Normal spontaneous vaginal delivery, t: test statistic, β: standardized linear regression coefficient, CI: confidence interval. |
||||||
| Table IV. Univariate and multivariate linear regression analysis for factors affecting cfPWV. | ||||||
|
|
|
|||||
|
|
|
|
|
|
|
|
| Age of mother |
|
|
|
|
|
|
| Maternal BMI |
|
|
|
|
|
|
| Parity |
|
|
|
|||
| Method of birth (ref: NSVD) |
|
|
|
|
|
|
| Sex (ref: Male) |
|
|
|
|
|
|
| Birth weight |
|
|
|
|||
| Maternal hemoglobin |
|
|
|
|||
| IVF |
|
|
|
|||
| HbA1c |
|
|
|
|
|
|
| Group (ref: Control Group) | ||||||
| Maternal hypertension |
|
|
|
|||
| Maternal diabetes |
|
|
|
|
|
|
In the multivariate linear regression model, maternal age (β=0.318, p=0.031) and maternal diabetes (β=0.635, p<0.001) remained independent predictors of the outcome variable. Maternal BMI (p=0.066), mode of delivery (p=0.720), neonatal sex (p=0.746), HbA1c level (p=0.822), parity, birth weight, maternal hemoglobin, IVF pregnancy, and maternal hypertension were not independently associated with the outcome.
The overall regression model demonstrated good explanatory capacity (R=0.797, R²=0.635, adjusted R²=0.543), indicating that approximately 63.5% of the variability in the outcome variable could be explained by the included predictors.
Discussion
Pulse wave velocity, a measure of arterial stiffness, predicts coronary heart disease, stroke, and cardiovascular mortality in adults.20 This study found that infants born to mothers with gestational diabetes had higher pulse wave velocity values compared to controls or infants born to mothers with gestational hypertension. These findings suggest that maternal metabolic status influences neonatal arterial stiffness. The differences in PWV indicate a potential cardiovascular risk, suggesting that newborns’ cardiovascular systems may undergo arterial stiffening due to maternal diabetes during the intrauterine period. The findings highlight the need to investigate prenatal diabetes exposure and examine the pathophysiological processes underlying vascular remodeling in newborns. Another important aspect was evaluating atrial and ventricular strain echocardiography, a technique not commonly used in neonates. Although the data showed no significant findings regarding early cardiac involvement, the assessment of atrial strain echocardiography for the first time in this population is noteworthy.
Increased PWV values have been documented in pediatric populations with conditions such as obesity, diabetes mellitus, and after heart transplantation procedures.21 Although the data are conflicting, some perinatal factors may affect arterial stiffness later in life. Increased pulse wave velocity has been reported in adolescents with a history of preterm delivery, as well as in children born small for gestational age or whose mothers consumed alcohol during pregnancy.22,23 Although there is limited research on pulse wave velocity in newborns, this remains an area that requires further exploration and clarification. In our study, the factors that may be associated with increased PWV in newborns were evaluated using the cfPWV method which is accepted as the gold standard.
Previous studies on pulse wave velocity in newborns report varying findings. One study measured aortic PWV of 30 newborns within 5 days and found an average of 4.6 m/s.10 Another study by Alwan et al. examined 284 infants aged 14 to 42 days and found a mean brachial-femoral PWV of 6.7 m/s (brachial-ankle PWV measurements in adults are approx. 20% higher than cfPWV measurements).24 A study using cardiac magnetic resonance imaging (MRI) on 15 newborns found PWV measurements from the thoracic arch to be 5.4 m/s in “time to peak” and 4.2 m/s in “time to foot” measurement.25 The mean cfPWV value of our control group was 4.56 m/s, consistent with two other studies but differing from Alwan et al (likely due to differences in measurement technique). PWV values varied across studies due to factors like ambient temperature, measurement timing, and patient agitation.26,27 Arterial stiffness can be assessed through various methods, with cfPWV recognized as the most effective non-invasive technique. While MRI provides superior measurements through three-dimensional imaging, its pediatric use is limited by sedation requirements, long examination time, high cost, and the need for specialized personnel. Echocardiographic assessment of cfPWV is the most reliable non-invasive indicator of aortic pulse wave velocity, though limited because the sternal notch to femoral artery distance doesn’t represent true aortic distance. Brachial-ankle and finger-toe pulse wave velocity measurements are less preferred as they don’t reflect true values, despite their rapid measurement.28 To standardize arterial stiffness assessment in newborns, examining large-scale cohort studies and the identification of influencing factors remains crucial.
The central finding of our study was that the cfPWV values were significantly elevated in infants born to mothers with gestational diabetes compared to both the infants of hypertensive mothers group and the healthy control group. No statistically significant difference was found between the infants of hypertensive mothers and the control group. Although there are very few studies in this area in newborns, PWV values were found to be increased in infants of diabetic mothers compared to the control group in the neonatal period9 and to be similar to the control group in infants of hypertensive mothers in the Baby VIP study.10 Subsequent studies on infants of diabetic mothers beyond the neonatal period have consistently reported elevated PWV values compared to the control group.29,30 However, the lack of significant findings regarding arterial stiffness in infants born to hypertensive mothers in our study and a few others could be attributed to the small sample sizes. Since increased PWV detected in infants of diabetic mothers may constitute a risk factor for cardiovascular diseases and end-organ damage, studies including long-term follow-up should be conducted in this field and these patients should be monitored more closely for cardiovascular diseases.
The results of the multivariate linear regression analysis in our study indicate that increased maternal age and maternal diabetes mellitus were the key factors predicting cfPWV values (p= 0.031 and ≤ 0.001 respectively). The findings of our study are consistent with those of previous studies. Previous studies have shown that hyperglycemia can have detrimental effects on endothelial progenitor cells31 and that advanced maternal age as well as gestational diabetes mellitus have been associated with impaired vascular development in newborns.32,33 Factors such as maternal BMI, parity, mode of delivery, birth weight, maternal hemoglobin levels, and IVF pregnancy did not significantly influence cfPWV in our study population.
In our study, the mode of delivery was not found to be an independent determinant of the outcome. Cesarean section demonstrated a borderline association in the univariate analysis (p=0.078); however, this relationship disappeared after adjustment for confounding variables in the multivariate model (p=0.720). This finding suggests that the apparent association observed initially was likely related to underlying maternal characteristics rather than the delivery route itself. In particular, cesarean delivery is more frequently performed in pregnancies complicated by maternal conditions such as diabetes or advanced maternal age, which may account for the unadjusted association. Therefore, the route of delivery alone does not appear to influence the studied outcome.
The gestational age was significantly lower in infants born to both hypertensive and diabetic mothers compared to the control group. No significant difference in gestational age was found between infants of mothers with diabetes and infants of hypertensive mothers. The existing literature provides relevant insights. A comprehensive study by Metclafe et al. found that diabetic mothers delivered their infants earlier than the control group, consistent with the findings in our study.34 Conversely, a cohort study by Palmsten et al. did not observe any difference in gestational age between hypertensive mothers and the control group.35 However, a 2021 study by Bello et al., which included 137,000 pregnant women, reported that hypertensive mothers gave birth at earlier gestational ages.36 Pregnancies complicated by hypertension and/or diabetes can result in metabolic and vascular abnormalities, as well as elevated risks of pregnancy-related complications. These factors may contribute to placental insufficiency, necessitating earlier delivery.37 Additionally, the increased frequency of cesarean sections observed among these patients in the present study may also be a factor in the earlier gestational age at birth.36
In this study, the mean IVSd in infants born to mothers with diabetes was significantly higher than in the control group. Studies on infants of diabetic mothers have reported elevated IVSd values compared to controls, attributed to increased insulin levels during pregnancy.29,38 According to Breatnach et al., there was no significant difference in interventricular septal diameter between infants of hypertensive mothers and controls in echocardiographic examinations within 48 hours after birth.39 Our findings corroborate earlier research, showing that infants of diabetic mothers have increased IVSd values compared to controls. However, we also observed that IVSd values in infants of hypertensive mothers were higher than in controls, contrary to existing literature. Previous studies have not reported similar findings regarding ventricular structures in infants of hypertensive mothers. Research by Vogg et al. showed that newborns exposed to maternal hypertensive disorders, particularly those born to preeclamptic mothers, exhibit increased thickness of left ventricular and septal walls compared to controls.40 While the reasons for this increased thickness remain unclear, it may be attributed to fetal hypoxia from maternal hypertension and elevated catecholamine levels. Vogg et al. noted limited evidence for this relationship in infants of hypertensive mothers without preeclampsia.40 Our study highlights the need for further investigations to evaluate these findings and elucidate potential pathophysiological associations.
The remodeling patterns of the left ventricle can be assessed through echocardiographic measurement of RWT and are categorized as normal or adverse. The adverse category is divided into eccentric or concentric remodeling. Research has shown that concentric remodeling, marked by high RWT, is associated with increased morbidity and mortality in hypertensive patients with hypertrophic cardiomyopathy.23 The mean RWT of infants in our study was 0.45±0.10. An RWT value exceeding 0.41 suggests concentric remodeling or concentric hypertrophy; these cardiac alterations are distinguished by LVMI, with no established range for this parameter in newborns. In a study on preterm newborns weighing up to 2 kg, the mean RWT was 0.33, with an upper limit of 0.38, corresponding to the 80th percentile.41 The lack of studies involving term newborns highlights the need for further research. In a study comparing a control group with infants born to diabetic mothers, both groups at 2 months of age, the RWT was 0.38 for controls and 0.5 for infants of diabetic mothers.41 Consistent with literature, our study found that RWT of infants born to mothers with diabetes was significantly higher than in the control group.
Myocardial deformation, referred to as strain, encompasses the percentage change in length or thickness from the initial state. Strain is a physical concept describing the relative deformation of an elastic structure in response to an applied force. Strain echocardiography was utilized to evaluate the strength and contractile performance of the cardiac musculature.42 The software developed for this method allows precise measurement of heart muscle motion in selected regions on 2D and 3D echocardiographic images. Strain echocardiography provides a more sensitive and quantitative assessment of myocardial function compared to traditional measures like ejection fraction, allowing for earlier detection of subtle abnormalities. It can detect changes in myocardial deformation that may not be apparent with conventional methods.43 The limited literature presents a mixed picture regarding ventricular strain in infants of mothers with diabetes and/or hypertension. Some studies have reported lower left and right ventricular values in infants of diabetic mothers compared to the control group.44 Other studies have found less negative left ventricular strain in infants of hypertensive mothers, but no difference in right ventricular strain.39 Additionally, another study observed no divergence in left or right ventricular strain between infants of hypertensive mothers and controls, though the right ventricular strain was less negative in infants of preeclamptic mothers relative to the control group.45 We observed a statistically significant difference between the groups in terms of the RV free wall longitudinal strain (p ≤ 0.001) in our study. The RV free wall strain longitudinal value of the infants of hypertensive mothers was significantly more negative than that of infants of the control group. There were no statistically significant differences in other strain parameters (p>0.05). Right ventricular strain parameters in neonates may be influenced by gestational age and postnatal cardiovascular adaptation, including transitional changes in pulmonary vascular resistance. The slightly lower gestational age in infants of hypertensive mothers may have contributed to the observed differences in RV strain parameters. However, these values remained within the normal range and were not considered clinically significant.46 Traditional parameters indicate atrial function through instantaneous measurement at a single point in the cardiac cycle. However, the empty volume and fraction in the atrial phase can also be calculated to assess atrial function. These measurements however are sensitive to atrial load and indirectly reflect the atrial myocardial properties. Analyzing atrial myocardial mechanics with strain and strain rate imaging is very important as it allows direct measurement of atrial myocardial deterioration.47 Atrial strain imaging in pediatric populations has been utilized to assess subtle atrial dysfunction, diastolic function, and remodeling in congenital heart disease, cardiomyopathies, and other conditions affecting cardiac function.48 Although no studies have specifically evaluated left atrial strain in newborns of diabetic and hypertensive mothers, to the best of our knowledge, this is the first study in the literature to address this topic. Our study’s left atrial reservoir strain of 47.89% and contraction strain of 15.04% were comparable to those reported in a study of healthy infants aged 0-24 months (52.8% and 14.2%, respectively).49 It is important to note that in our study, there were no statistically significant differences in left atrial strain parameters between newborns of diabetic or hypertensive mothers and the control group, suggesting that, within our cohort, maternal diabetes and hypertension may not have a significant impact on neonatal left atrial function as assessed by strain echocardiography.
Limitations
Despite these findings, several limitations of the present study should be considered when interpreting the findings. First, the sample size was relatively small, particularly in the subgroup of infants of hypertensive mothers, which may have limited statistical power. Second, although maternal diagnoses were established according to standard clinical criteria during routine antenatal follow-up, subclinical metabolic alterations cannot be completely excluded. Finally, neonatal blood pressure was not systematically measured during echocardiographic assessment, although all infants were clinically stable at the time of examination and a substantial proportion were delivered and monitored at our institution.
Conclusion
The analysis of arterial stiffness in infants of diabetic mothers, infants of hypertensive mothers, and controls showed that advanced maternal age and maternal diabetes were particularly associated with increased cfPWV. Although increased cfPWV has been shown to be associated with cardiovascular events and end-organ damage, its effect in newborns is not clearly known. Echocardiographic assessment revealed an increased thickness of the interventricular septum in infants born to mothers with diabetes and hypertension, as compared to the control group. Additionally, RWT was observed to be higher in infants of diabetic mothers. This study highlights the potential influence of maternal metabolic status on neonatal cardiac morphology and vascular function. In contrast, atrial and ventricular strain parameters were not significantly affected in this patient group. The findings suggest that maternal metabolic status can influence neonatal cardiac morphology and vascular function. Based on the data presented, further research is warranted to investigate whether the observed effects on arterial stiffness in infants of diabetic mothers persist into older ages and have long-term implications for the health of these patients.
Acknowledgements
We would like to acknowledge the contributions of all families who agreed to participate in this study.
Ethical approval
This study was approved by the Hacettepe University Non-Interventional Clinical Research Ethics Committee on 20/09/2022 (Project No: GO 22/887, Decision No: 2022/18–34).
Source of funding
The authors declare the study received no funding.
Conflict of interest
The authors declare that there is no conflict of interest.
References
- Dobrin PB. Mechanical properties of arteries. Physiol Rev 1978; 58: 397-460. https://doi.org/10.1152/physrev.1978.58.2.397
- Roach MR, Burton AC The effect of age on the elasticity of human iliac arteries. Can J Biochem Physiol 1959; 37: 557-570.
- Park S, Lakatta EG. Role of inflammation in the pathogenesis of arterial stiffness. Yonsei Med J 2012; 53: 258-261. https://doi.org/10.3349/ymj.2012.53.2.258
- Laurent S, Boutouyrie P. Arterial stiffness and hypertension in the elderly. Front Cardiovasc Med 2020; 7: 544302. https://doi.org/10.3389/fcvm.2020.544302
- Laurent S, Cockcroft J, Van Bortel L, et al. Expert consensus document on arterial stiffness: methodological issues and clinical applications. Eur Heart J 2006; 27: 2588-2605. https://doi.org/10.1093/eurheartj/ehl254
- Laurent S, Katsahian S, Fassot C, et al. Aortic stiffness is an independent predictor of fatal stroke in essential hypertension. Stroke 2003; 34: 1203-1206. https://doi.org/10.1161/01.STR.0000065428.03209.64
- Blacher J, Safar ME, Guerin AP, Pannier B, Marchais SJ, London GM. Aortic pulse wave velocity index and mortality in end-stage renal disease. Kidney Int 2003; 63: 1852-1860. https://doi.org/10.1046/j.1523-1755.2003.00932.x
- National High Blood Pressure Education Program Working Group on High Blood Pressure in Children and Adolescents. The fourth report on the diagnosis, evaluation, and treatment of high blood pressure in children and adolescents. Pediatrics 2004; 114: 555-576.
- Barker DJ, Osmond C, Golding J, Kuh D, Wadsworth ME. Growth in utero, blood pressure in childhood and adult life, and mortality from cardiovascular disease. BMJ 1989; 298: 564-567. https://doi.org/10.1136/bmj.298.6673.564
- Koudsi A, Oldroyd J, McElduff P, Banerjee M, Vyas A, Cruickshank JK. Maternal and neonatal influences on, and reproducibility of, neonatal aortic pulse wave velocity. Hypertension 2007; 49: 225-231. https://doi.org/10.1161/01.HYP.0000250434.73119.7a
- Chen S, Chetty S, Lowenthal A, et al. Feasibility of neonatal pulse wave velocity and association with maternal hemoglobin A1c. Neonatology 2015; 107: 20-26. https://doi.org/10.1159/000366467
- Ng KYB, Simpson NAB, Cade JE, et al. Is infant arterial stiffness associated with maternal blood pressure in pregnancy? Findings from a UK birth cohort (Baby VIP study). PLoS One 2018; 13: e0200159. https://doi.org/10.1371/journal.pone.0200159
- Weber T, Chirinos JA. Pulsatile arterial haemodynamics in heart failure. Eur Heart J 2018; 39: 3847-3854. https://doi.org/10.1093/eurheartj/ehy346
- Hedman K, Cauwenberghs N, Christle JW, Kuznetsova T, Haddad F, Myers J. Workload-indexed blood pressure response is superior to peak systolic blood pressure in predicting all-cause mortality. Eur J Prev Cardiol 2020; 27: 978-987. https://doi.org/10.1177/2047487319877268
- Nahili KA, Saleem I, Ahmad S, Ahmed ET, Rajaa NA. Left ventricular strain in neonates using 2-dimensional speckle tracking: normal range and relation with bi-plan ejection fraction. Echocardiography 2022; 39: 1074-1081. https://doi.org/10.1111/echo.15414
- ElSayed NA, Aleppo G, Aroda VR, et al. 15. Management of diabetes in pregnancy: standards of care in diabetes-2023. Diabetes Care 2023; 46: S254-S266. https://doi.org/10.2337/dc23-S015
- Garovic VD, Dechend R, Easterling T, et al. Hypertension in pregnancy: diagnosis, blood pressure goals, and pharmacotherapy: a scientific statement from the American Heart Association. Hypertension 2022; 79: e21-e41. https://doi.org/10.1161/HYP.0000000000000208
- Lopez L, Colan SD, Frommelt PC, et al. Recommendations for quantification methods during the performance of a pediatric echocardiogram: a report from the Pediatric Measurements Writing Group of the American Society of Echocardiography Pediatric and Congenital Heart Disease Council. J Am Soc Echocardiogr 2010; 23: 465-95; quiz 576-7. https://doi.org/10.1016/j.echo.2010.03.019
- Biton Y, Goldenberg I, Kutyifa V, et al. Relative wall thickness and the risk for ventricular tachyarrhythmias in patients with left ventricular dysfunction. J Am Coll Cardiol 2016; 67: 303-312. https://doi.org/10.1016/j.jacc.2015.10.076
- Sutton-Tyrrell K, Najjar SS, Boudreau RM, et al. Elevated aortic pulse wave velocity, a marker of arterial stiffness, predicts cardiovascular events in well-functioning older adults. Circulation 2005; 111: 3384-3390. https://doi.org/10.1161/CIRCULATIONAHA.104.483628
- Urbina EM, Kimball TR, Khoury PR, Daniels SR, Dolan LM. Increased arterial stiffness is found in adolescents with obesity or obesity-related type 2 diabetes mellitus. J Hypertens 2010; 28: 1692-1698. https://doi.org/10.1097/HJH.0b013e32833a6132
- Lazdam M, de la Horra A, Pitcher A, et al. Elevated blood pressure in offspring born premature to hypertensive pregnancy: is endothelial dysfunction the underlying vascular mechanism? Hypertension 2010; 56: 159-165. https://doi.org/10.1161/HYPERTENSIONAHA.110.150235
- Morley R, Dwyer T, Hynes KL, et al. Maternal alcohol intake and offspring pulse wave velocity. Neonatology 2010; 97: 204-211. https://doi.org/10.1159/000252973
- Alwan NA, Cade JE, McArdle HJ, et al. Infant arterial stiffness and maternal ıron status in pregnancy: a UK birth cohort (Baby VIP Study). Neonatology 2015; 107: 297-303. https://doi.org/10.1159/000377618
- Lundström S, Liefke J, Heiberg E, Hedström E. Pulse wave velocity measurements by magnetic resonance ımaging in neonates and adolescents: methodological aspects and their clinical ımplications. Pediatr Cardiol 2022; 43: 1631-1644. https://doi.org/10.1007/s00246-022-02894-0
- Bodlaj G, Berg J, Biesenbach G. Diurnal variation of pulse wave velocity assessed non-invasively by applanation tonometry in young healthy men. Yonsei Med J 2007; 48: 665-670. https://doi.org/10.3349/ymj.2007.48.4.665
- Adamopoulos D, Vyssoulis G, Karpanou E, et al. Environmental determinants of blood pressure, arterial stiffness, and central hemodynamics. J Hypertens 2010; 28: 903-909. https://doi.org/10.1097/hjh.0b013e3283369f67
- Segers P, Rietzschel ER, Chirinos JA. How to measure arterial stiffness in humans. Arterioscler Thromb Vasc Biol 2020; 40: 1034-1043. https://doi.org/10.1161/ATVBAHA.119.313132
- Do V, Eckersley L, Lin L, et al. Persistent aortic stiffness and left ventricular hypertrophy in children of diabetic mothers. CJC Open 2020; 3: 345-353. https://doi.org/10.1016/j.cjco.2020.10.020
- Yuan WL, Lin J, Kramer MS, et al. Maternal glycemia during pregnancy and child carotid ıntima media thickness, pulse wave velocity, and augmentation ındex. J Clin Endocrinol Metab 2020; 105: dgaa211. https://doi.org/10.1210/clinem/dgaa211
- Lien IZ, Dropcho E, Mead L, Ingram DA, Haneline LS. 15 The effects of hyperglycemia on newborn endothelial progenitor cells. Pediatr Res 2006; 60: 493. https://doi.org/10.1203/00006450-200610000-00037.
- Mezu-Ndubuisi OJ, Maheshwari A. Role of the endothelium in neonatal diseases. Newborn (Clarksville) 2022; 1: 44-57. https://doi.org/10.5005/jp-journals-11002-0025
- Rodrigues I, Soares H, Rocha G, Azevedo I. Impact of advanced maternal age on neonatal morbidity: a systematic review. J Matern Fetal Neonatal Med 2023; 36: 2287981. https://doi.org/10.1080/14767058.2023.2287981
- Metcalfe A, Hutcheon JA, Sabr Y, et al. Timing of delivery in women with diabetes: a population-based study. Acta Obstet Gynecol Scand 2020; 99: 341-349. https://doi.org/10.1111/aogs.13761
- Palmsten K, Buka SL, Michels KB. Maternal pregnancy-related hypertension and risk for hypertension in offspring later in life. Obstet Gynecol 2010; 116: 858-864. https://doi.org/10.1097/AOG.0b013e3181f3a1f9
- Bello NA, Zhou H, Cheetham TC, et al. Prevalence of hypertension among pregnant women when using the 2017 American College of Cardiology/American Heart Association blood pressure guidelines and association with maternal and fetal outcomes. JAMA Netw Open 2021; 4: e213808. https://doi.org/10.1001/jamanetworkopen.2021.3808
- Aziz F, Khan MF, Moiz A. Gestational diabetes mellitus, hypertension, and dyslipidemia as the risk factors of preeclampsia. Sci Rep 2024; 14: 6182. https://doi.org/10.1038/s41598-024-56790-z
- Stegeman R, Paauw ND, de Graaf R, van Loon RLE, Termote JUM, Breur JMPJ. The etiology of cardiac hypertrophy in infants. Sci Rep 2021; 11: 10626. https://doi.org/10.1038/s41598-021-90128-3
- Breatnach CR, Monteith C, McSweeney L, et al. The ımpact of maternal gestational hypertension and the use of anti-hypertensives on neonatal myocardial performance. Neonatology 2018; 113: 21-26. https://doi.org/10.1159/000480396
- Vøgg ROB, Hansen JV, Sillesen AS, et al. Maternal hypertensive disorders of pregnancy and cardiac structure and function in the newborn. JACC Adv 2022; 1: 100059. https://doi.org/10.1016/j.jacadv.2022.100059
- Sikdar J, Das PS, Halder D, et al. Echocardiographic evaluation of infants born to mothers with gestational diabetes mellitus: a cross-sectional analytical study. Journal of Clinical and Diagnostic Research 2024; 18: CC01-CC05. https://doi.org/10.7860/JCDR/2024/71042.19659
- Shah AM, Solomon SD. Myocardial deformation imaging: current status and future directions. Circulation 2012; 125: e244-e248. https://doi.org/10.1161/CIRCULATIONAHA.111.086348
- Cameli M. Echocardiography strain: why is it used more and more? Eur Heart J Suppl 2022; 24: I38-I42. https://doi.org/10.1093/eurheartjsupp/suac070
- Smith A, Franklin O, McCallion N, Breatnach F, El-Khuffash A. Effect of gestational diabetes mellitus on neonatal myocardial function. Neonatology 2021; 118: 64-72. https://doi.org/10.1159/000513041
- Yu L, Zhou Q, Peng Q, Zeng S, Yang Z. Velocity vector imaging echocardiography and NT-proBNP study of fetal cardiac function in pregnancy-induced maternal hypertension. J Clin Ultrasound 2019; 47: 285-291. https://doi.org/10.1002/jcu.22720
- Peček J, Koželj M, Lenasi H, Fister P. Right ventricular function in neonates during early postnatal period: a prospective observational study. Pediatr Cardiol 2022; 43: 1327-1337. https://doi.org/10.1007/s00246-022-02855-7
- Uçar FM, Yılmaztepe MA. Relation between left atrial strain function and coronary slow flow phenomenon using two-dimensional speckle-tracking echocardiography. Koşuyolu Heart J 2018; 21: 21-25. https://doi.org/10.5578/khj.57251
- Sabatino J, Di Salvo G, Prota C, et al. Left atrial strain to ıdentify diastolic dysfunction in children with cardiomyopathies. J Clin Med 2019; 8: 1243. https://doi.org/10.3390/jcm8081243
- Cantinotti M, Scalese M, Giordano R, et al. Left and right atrial strain in healthy caucasian children by two-dimensional speckle-tracking echocardiography. J Am Soc Echocardiogr 2019; 32: 165-168.e3. https://doi.org/10.1016/j.echo.2018.10.002
Copyright and license
Copyright © 2026 The Author(s). This is an open access article distributed under the Creative Commons Attribution License (CC BY), which permits unrestricted use, distribution, and reproduction in any medium or format, provided the original work is properly cited.