Abstract
Background. Esophageal atresia (EA) is a congenital malformation often associated with long-term gastrointestinal complications and impaired growth. This study aimed to evaluate anthropometric outcomes in children with EA, with particular attention to the impact of associated conditions such as anastomotic stricture and gastroesophageal reflux (GER).
Methods. We conducted a retrospective analysis of patients with type C EA who underwent primary anastomosis between 2005 and 2021. Anthropometric data were collected at four age intervals (<1 year, 1–4 years, 5–11 years, >11 years) and standardized using validated growth charts. Associations between anthropometric parameters and the presence of stricture or GER were analyzed.
Results. Fifty-seven patients met the inclusion criteria. Stricture and GER were identified in 32% and 30% of patients, respectively. Infants (<1 year) with stricture had significantly lower BMI Z-scores -2.5 ± 0.7 than those without stricture (-1.1 ± 1.1; p=0.0093), while those with GER had significantly lower weight Z-scores (-2.1 ± 1.0) than those without GER (-1.2 ± 1.1; p=0.0443). Although most patients showed improvement in anthropometric parameters with age, early growth impairment was consistently observed in association with these complications.
Conclusions. Children with EA are at risk of impaired growth during early childhood, particularly when stricture or GER is present. Regular anthropometric monitoring and early nutritional intervention are crucial, especially within the first year of life. Long-term multidisciplinary follow-up is recommended to optimize developmental outcomes.
Keywords: esophageal atresia, esophageal stricture, gastroesophageal reflux, growth, nutritional status
Introduction
Esophageal atresia (EA) is a congenital anomaly occurring in approximately 1 in 2,500 to 3,000 live births.1 According to Gross’s classification, type C—characterized by a proximal esophageal atresia with a distal tracheoesophageal fistula (TEF)—is the most prevalent form, accounting for about 85% of cases.2
Patients with EA often experience both short- and long-term comorbidities.3-5 From a gastrointestinal perspective, common complications include esophageal stricture, gastroesophageal reflux (GER), and dysphagia.6,7
Esophageal stricture, the most frequent postoperative complication, affects up to 60% of patients.6 This condition often necessitates endoscopic intervention and can lead to symptoms such as dysphagia, vomiting, coughing, recurrent respiratory infections, and impaired weight gain.8-10
In addition to esophageal stricture, GER is also prevalent among patients with EA, with a reported incidence ranging from 20% to 63%, depending on age and diagnostic methods.6,11 Complications arising from GER, including anastomotic stenosis, esophagitis, and Barrett’s esophagus, can manifest throughout development.12,13
Studies have reported lower height and weight-for-age values in children with EA compared with healthy age-matched populations.3,14,15 However, the influence of comorbidities on these anthropometric measures remains underexplored.16
Therefore, the aim of this study was to evaluate longitudinal anthropometric outcomes (weight, height/length, and Body Mass Index [BMI]) in children with repaired type C EA, and to assess the association of anastomotic stricture and GER with growth trajectories within a repeated-measures follow-up dataset, while also exploring clinically relevant factors such as prematurity.
Materials and Methods
This retrospective study analyzed the medical records of all surviving patients who underwent primary anastomosis surgery for type C EA at our institution between 2005 and 2021. To reduce potential confounding factors, patients with non-type C atresia or long-gap EA were excluded due to their distinct clinical presentations, including a tendency toward higher complication rates and the need for multiple surgeries.17,18 Additionally, individuals with incomplete medical records, those lost to postnatal follow-up, or those who died in the immediate perinatal period were not included in the study. Sample size was determined by the availability of eligible cases.
Patient data were categorized into four age groups following the age intervals used by Coppens et al.19 in the study that informed the design of the present study. The groups included infants younger than 1 year, children aged 1 to 4 years, those aged 5 to 11 years, and adolescents older than 11 years. EA type was classified according to Gross’s classification system.2
Data collection
Demographic, clinical, perinatal, surgical, and postoperative data were extracted from patient records. Raw anthropometric data (weight and height) for each patient were collected at each of the four age intervals, for age-specific analyses within the longitudinal repeated-measures dataset. These values were subsequently entered into a nutritional calculator, a software application that adjusts measurements according to age- and sex-specific reference growth curves and converts them into Z-scores and percentiles.
Anthropometric measurements were standardized using the SEGHNP nutritional calculator.20 Weight and length/height were converted to Z-scores and percentiles using the reference growth curves by Carrascosa et al. (2010)21, and BMI Z-scores were obtained using the same tool.
As each patient’s data corresponded to different dates, these were standardized using the nutritional calculator, into which we entered both the date of birth and the date of each anthropometric measurement. The calculator determined each patient’s age at the time of measurement and compared the values with the corresponding age-matched reference curves. For the purposes of this study, Z-scores were chosen as the primary metric because they provide a more precise quantification of deviation from the reference population.
Although Z-scores were used as the primary analytic measures, raw anthropometric values are provided for transparency. Supplementary Table S1 summarizes weight (kg) and length/height (cm) by age interval.
Diagnostic evaluations
Patients presenting with dysphagia underwent an initial contrast esophagography. If a stricture was detected, upper endoscopy was performed for evaluation and, if necessary, dilation. Patients with symptoms suggestive of GER or positive reflux findings on esophagography underwent 24-hour esophageal pH monitoring or upper endoscopy with esophageal biopsy, as indicated when suspicious findings were encountered. There was no protocol for prophylactic proton pump inhibitor (PPI) administration in patients under one year of age, because patients in the study were treated over a relatively long time span and such a protocol was implemented only in more recent years.
Statistical analysis
Data were analyzed using IBM SPSS Statistics version 29 and R software version 4.1.1. Descriptive statistics were used to summarize the characteristics of the cohort. The distribution of continuous variables was assessed for normality using the Shapiro-Wilk test. Variables with a normal distribution are presented as mean ± standard deviation (SD), whereas non-normally distributed variables are expressed as median and interquartile range (Q1-Q3). However, in selected cases, mean ± SD was also reported for variables that did not follow a normal distribution, as extreme values were considered part of the expected clinical variability in this population rather than true outliers. This approach was intended to better reflect the real-world distribution of anthropometric outcomes in patients with postoperative complications. Categorical variables are reported as frequencies and percentages.
Anthropometric Z-scores are summarized using mean ± SD for variables compatible with normality and median (Q1–Q3) for non-normally distributed variables. For transparency, Table II reports both summaries by age interval. When subgroup sizes were very small, results are presented descriptively and interpreted as exploratory.
|
Anthropometric values: Weight, height and BMI showing a normalizing trend along with growing age. Not normally distributed values according to Shapiro-Wilk test are shown in bold. SD: Standard Deviation. Q1-Q3: First and third Quartile values. BMI: Body Mass Index. N: Number of patients. |
|||||||
| Table II. Mean and median anthropometric values according to age groups. | |||||||
| Age group |
|
|
|
|
|
|
|
| <1y |
|
|
|
|
|
|
|
| 1-4y |
|
|
|
|
|
|
|
| 5-11y |
|
|
|
|
|
|
|
| > 11 y |
|
|
|
|
|
|
|
Longitudinal changes in anthropometric Z-scores (weight, height/length, and BMI) across age intervals were analyzed using the Friedman test. When the overall test was statistically significant, post hoc pairwise comparisons were performed using the Wilcoxon signed-rank test. For age-specific comparisons between patients with and without anastomotic stricture or GER, Welch’s t-test (R) for normally distributed variables and the Mann-Whitney U test (R) for non-normally distributed variables were used when subgroup sizes were sufficient; when very small subgroups (n<5) were present, results were reported descriptively without p-values.
Associations between categorical variables were assessed using Chi-square tests, and Fisher’s exact test was applied to 2×2 contingency tables when expected frequencies were small. Potential confounders and modifying factors (including prematurity and associated anomalies) were explored by comparing groups using Fisher’s exact test. A p-value < 0.05 was considered statistically significant, except where adjusted for multiple comparisons as described above. We explored multivariable repeated-measures approaches; however, sparse data in several age-by-complication strata and unbalanced follow-up precluded stable model estimation.
Results
A total of 76 clinical records were reviewed, of which 19 were excluded. Seven were incomplete, and six corresponded to patients who died in the immediate perinatal period due to associated life-threatening conditions. Another six patients were excluded because they presented with a different type of EA: three had type A, one had type D, and two had type C with long-gap EA requiring delayed surgery. After exclusions, 57 patients met the study’s inclusion criteria.
After categorizing the 57 patients by age group, anthropometric and clinical data were available for 56 of <1 year, 51 of 1-4 years, 30 of 5-11 years and 12 of > 11 years.
This was influenced by the patients’ ages at the time of the study (conducted between 2021 and 2022) and loss to follow-up.
Although all patients (n=57) were alive at the end of the first year, the number of patients is reflected as 56 because data from the first year were unavailable for one patient.
An open surgical approach was used in 56 patients, with only one case managed thoracoscopically. Twenty patients were premature and 37 patients were born at term with mean gestational ages of 34.05 and 38.89 weeks respectively.
Associated anomalies were present throughout the sample in various forms across the sample: There were 7 cases of vertebral defects, anal atresia, cardiac defects, tracheo-esophageal fistula, renal defects, and limb defects (VACTERL) association and 1 case of trisomy 21. Eighteen cases had cardiac anomalies (defined as such in the immediate neonatal period based on preoperative cardiac ultrasound) consisting of 12 ostium secundum atrial septal defects, 4 ventricular septal defects and 2 cases of mild valvular insufficiency, while patent ductus arteriosus and patent foramen ovale were considered as minor findings and were excluded. Information regarding subsequent cardiac surgical interventions was not systematically collected. Urological anomalies were present in 7 cases including hypospadias, urinary tract dilatation, renal agenesis or hypoplasia and horseshoe kidney.
Potential confounding and modifying factors related to growth and nutritional outcomes were also recorded. Prematurity was present in 20 patients (35.1%). Low birth weight (<2500 g) was observed in 26 patients (46%). GER requiring surgical treatment occurred in 5 patients during the first year of life and in 4 patients during the 1–4-year interval. Nutritional support measures included gastrostomy in 2 patients during the first year and 3 patients during the 1–4-year interval (2 of whom were the same patients recorded in the <1-year group), while nasogastric tube feeding was required in 5 and 1 patients (with the latter patient continuing from the previous <1 year age group), respectively. Four patients in the <1-year group and one patient in the 1–4-year group were unable to maintain full oral feeding at some point during follow-up. Consequently, oral feeding was achieved in 52/56 patients in the <1-year group, 50/51 in the 1–4-year group, and in all patients in the older age groups (30/30 aged 5–11 years and 12/12 aged >11 years).
Anastomotic stricture was present in 32% of patients (n = 18), and GER in 30% (n = 17), with both conditions varying across age groups, as shown in Table I.
|
Prevalence of complications: Presence or esophageal stricture or gastroesophageal reflux in each of the age groups. GER: Gastroesophageal Reflux. |
||
| Table I. Prevalence of complications by age group. | ||
| Age Group |
|
|
| < 1 year (n=56) |
|
|
| 1–4 years (n=51) |
|
|
| 5–11 years (n=30) |
|
|
| > 11 years (n=12) |
|
|
Anastomotic stricture in the < 1-year group was present in 8 cases, 5 of which persisted into the 1-4 years period, during which 7 new cases were diagnosed. In the 5- 11 years group, 4 strictures corresponded to recurrences (having been present in any of the previous age groups) and 3 were newly-diagnosed.
Anthropometric parameters (weight, height, and BMI) from the entire sample are expressed as standardized Z-scores and are shown in Table II; data availability varied across age intervals due to differences in follow-up. Raw anthropometric measurements (weight in kg and length/height in cm) are presented in Supplementary Table S1.
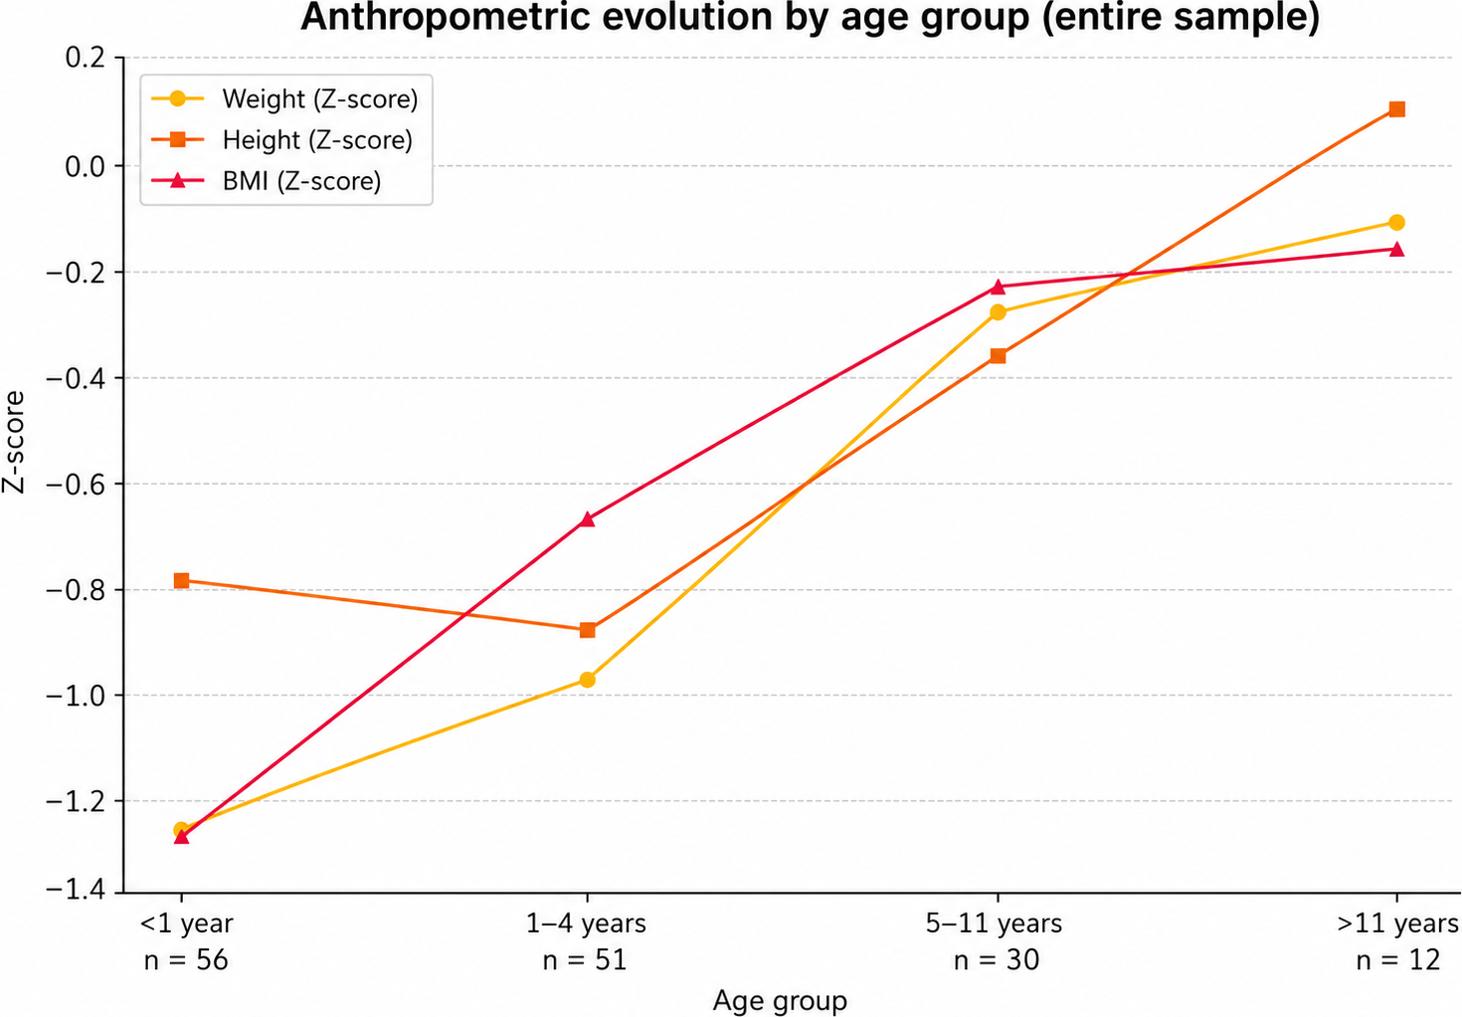
Normality of the anthropometric variables was assessed using the Shapiro–Wilk test. Several distributions deviated significantly from normality, particularly in the older age groups, justifying the use of non-parametric methods. The Friedman test revealed statistically significant differences across age groups for weight Z-scores (χ2(3) = 15.278, p = 0.002) and BMI Z-scores (χ2(3) = 23.29, p = 0.001), while height Z-scores showed no significant differences (χ2(3) = 4.909, p = 0.179). Post hoc pairwise comparisons using the Wilcoxon signed-rank test identified significant improvements in weight and BMI during early childhood. The results of these analyses are summarized in Table III.
|
Z values and p-values are shown for each comparison. Descriptive statistics for each age interval are reported in Table II and should be interpreted alongside these post hoc comparisons. BMI: Body Mass Index. |
|||
| Table III. Post hoc pairwise comparisons of anthropometric Z-scores across age groups using the Wilcoxon signed-rank test. | |||
| Variable |
|
|
|
| Weight Z-score |
|
|
|
| Weight Z-score |
|
|
|
| Weight Z-score |
|
|
|
| Weight Z-score |
|
|
|
| Weight Z-score |
|
|
|
| BMI Z-score |
|
|
|
| BMI Z-score |
|
|
|
| BMI Z-score |
|
|
|
| BMI Z-score |
|
|
|
| BMI Z-score |
|
|
|
| Height Z-score |
|
|
|
There was a trend toward normalization of Z-scores with age as shown in Fig. 1.
To assess the distribution of possible confounders (prematurity, low birth weight) and modifying factors (cardiac, digestive and urological anomalies, and the presence of VACTERL association), Fisher’s exact test was applied to 2×2 contingency tables, individually evaluating the presence or absence of these conditions in patients with or without stricture and with or without GER. Prematurity was the only factor showing an unequal distribution between comparison groups: in the 5–11-year interval, stricture was more frequent among premature patients (5/10) than among term patients (2/20; p= 0.026). No other statistically significant imbalances were observed for the remaining factors assessed.
We explored the feasibility of a linear mixed-effects model to account for within-subject correlation across repeated measurements and to evaluate the effects of anastomotic stricture and GER over time. However, due to unbalanced follow-up across age intervals and sparse data in several age-by-complication combinations, the model did not converge and produced unstable estimates. Accordingly, we did not report mixed-effects results and proceeded with the complementary approaches described below.
As an alternative, we employed two complementary approaches. First, we aggregated anthropometric Z-scores (weight, height, and BMI) across all time points for each patient and compared the mean values between those who had a stricture or gastroesophageal reflux at any time and those who did not. The Shapiro–Wilk test was used to assess normality, and Welch’s t-test was applied to compare means between groups without assuming equal variances. No statistically significant differences were found in average weight Z-score (p=0.989), height Z-score (p = 0.342), or BMI Z-score (p = 0.454) between patients with and without stricture.
In the case of GER, a significantly lower mean height Z-score was observed in patients with GER compared to those without (p = 0.037), while differences in weight (p = 0.140) and BMI (p = 0.547) were not statistically significant.
Second, anthropometric outcomes were compared between patients with and without stricture or GER within each age group, again using Welch’s t-test (for normally distributed values) or Mann-Whitney U test (for non-normally distributed values) to account for possible differences in variance.
When comparing anthropometric parameters between patients with and without stricture, statistically significant differences were found only in BMI values for those under 12 months of age (Table IV). No other statistically significant differences were found in the remaining age groups or parameters (Supplementary Table S2).
|
Anthropometric measurements in the < 1-year group comparing values (normal distribution) with Welch’s t-test in patients according to the presence or absence of esophageal stricture. Z-score values are presented as mean ± standard deviation. BMI: Body Mass Index. SD: Standard Deviation. N: Number of patients. |
||||
| Table IV. Mean anthropometric measures by stricture presence (<1 year). | ||||
| Anthropometric value | Group |
|
|
|
| Weight <1y | No Stricture |
|
|
|
| Stricture |
|
|
|
|
| Height <1y | No Stricture |
|
|
|
| Stricture |
|
|
|
|
| BMI <1y | No Stricture |
|
|
|
| Stricture |
|
|
|
|
When comparing patients with and without GER, statistically significant differences were found only in weight for patients under 12 months of age (Table V). No other statistically significant differences were observed across age groups or variables (Supplementary Table S3). The very wide ranges observed in the >11-year GER-positive subgroup were driven by the extremely small sample size (n = 2). All extreme values were verified against source records and considered clinically plausible
|
Comparison of anthropometric measurements (normal distribution) with Welch’s t-test in the < 1-year group according to the presence or absence of gastroesophageal reflux. Z-score values are presented as mean ± standard deviation. SD: Standard Deviation GER: Gastroesophageal Reflux. BMI: Body Mass Index. N: Number of patients. |
||||
| Table V. Anthropometric measures by GER presence (<1 year). | ||||
| Anthropometric value | Group |
|
|
|
| Weight <1y | No GER |
|
|
|
| GER |
|
|
||
| Height <1y | No GER |
|
|
|
| GER |
|
|
||
| BMI <1y | No GER |
|
|
|
| GER |
|
|
||
Respiratory symptoms (bronchitis, pneumonia) were very frequent in patients with GER (7/8 patients with GER in the < 1 year-group had respiratory symptoms, as did 6/7 in the 1-4 years group, 5/5 in the 5-11 year-group and 2/2 in the >11 year-group).
Although the data may suggest more complete follow-up of complicated cases, data availability varied for each age group due to the timing of the study (years 2021-2022). At the time, the oldest patients were 15-16 years old data were available for 12 / 17 patients in the > 11-year-age group.
Discussion
This study evaluated the long-term nutritional status of children with EA, emphasizing the impact of associated complications such as anastomotic stricture and GER. Our findings show that while overall growth parameters tend to normalize with age, children under 12 months of age appear to be more vulnerable to nutritional compromise, especially in the presence of stricture or GER.
In our cohort, 32% of patients presented with stricture and 30% with GER. These complications were more frequently observed in the first few years of life and were associated with lower weight and BMI Z-scores. Although statistical significance was reached only for BMI (for stricture) and weight (for GER) among infants under 1 year, we observed a non-significant trend toward lower anthropometric parameters across all age groups when these conditions were present. These findings align with studies by Legrand et al.3 and Puntis et al.14, which underscore the contribution of reflux and stricture to early growth impairment.
Importantly, Depoortere et al.22 conducted a large, population-based prospective cohort study and found that at 1 year of age, 15% of patients with EA were undernourished and 19% showed stunting, with no significant catch-up growth observed between 6 and 12 months. These results reinforce the idea that the first year of life is a critical window for nutritional monitoring and intervention. They also emphasize the role of comorbidities such as low birth weight, prematurity, and associated anomalies, which were also present in a significant proportion of our cohort.
Similarly, Maan et al.23 reported that 30% to 40% of children aged 1–5 years who had undergone EA/TEF repair were underweight, stunted, or wasted compared with healthy controls. Interestingly, they noted that children who underwent primary repair had better nutritional outcomes than those who had staged repairs—highlighting the influence of surgical strategy on growth. In our study, most patients underwent open primary repair, which may partly explain the positive long-term trends observed in older age groups.
Feeding difficulties are another major factor that contributes to growth delays in patients with EA. Studies have shown that these difficulties often persist into childhood and are multifactorial, involving dysmotility, aspiration, inflammation, and behavioral components.6,13,14 Although our study did not formally assess feeding behavior, the presence of GER and stricture—both known contributors to feeding difficulties—likely played a role in early nutritional deficits.
Despite the relatively high rate of early complications, long-term growth outcomes in our study are encouraging. Patients aged 5-11 years and older than 11 years showed near-normal Z-scores for weight, height, and BMI, echoing the findings of other longitudinal studies that describe gradual catch-up growth.24,25 Nevertheless, the absence of consistent catch-up growth in some subsets—particularly those with more complex cases or delayed surgery—remains a concern and justifies long-term multidisciplinary follow-up.
This study has several limitations that should be acknowledged. First, its retrospective design inherently limits the ability to control for confounding variables and introduces potential biases related to data completeness and accuracy. Second, the study was conducted at a single center, which may affect the generalizability of the findings to other populations or healthcare settings. Third, the sample includes patients treated over a relatively long time span, during which changes in surgical techniques, nutritional protocols, and follow-up practices may have occurred. This temporal heterogeneity could have introduced variability in outcomes that was not fully captured or adjusted for in the analysis. Although prematurity was assessed as a potential confounder through subgroup distribution testing, the sample size and sparse strata limited further multivariable adjustment, and residual confounding cannot be excluded. Additionally, in patients with VACTERL association or associated anomalies, growth-restricting genetic factors may be present.
Finally, imbalances in group size in some age comparisons (Table IV, Supplementary Table S2, Table V) and very small subgroups in others (e.g., n = 2 in Supplementary Table S3) represent a further limitation. These issues are inherent to the rarity of the condition and the retrospective nature of the cohort. Although statistical tests were applied with caution, results from these small subgroups should be interpreted as exploratory and descriptive. Additionally, although some continuous variables did not follow a normal distribution, we reported mean ± standard deviation in addition to median (Q1-Q3) to provide a comprehensive description of anthropometric outcomes. This decision, discussed in the methods section, was based on the clinical relevance of extreme values, which were not considered outliers but rather part of the expected variability in this patient population.
In conclusion, our findings support the growing consensus that children with EA require early and long-term nutritional surveillance, especially during the first year of life. The inclusion of comorbidity screening and feeding assessments into follow-up protocols may allow for more personalized management. Further prospective, multicenter studies are needed to better characterize long-term growth trajectories and define optimal nutritional strategies for this complex population.
Ethical approval
The study was approved by Research Ethics Committee of the Community of Aragón (CEICA), with Institutional Review Board (IRB) (date: September 24, 2021, number: C.P.-C.I. PI21/400).
Source of funding
The authors declare the study received no funding.
Conflict of interest
The authors declare that there is no conflict of interest.
References
- Depaepe A, Dolk H, Lechat MF. The epidemiology of tracheo-oesophageal fistula and oesophageal atresia in Europe. EUROCAT Working Group. Arch Dis Child 1993; 68: 743-748. https://doi.org/10.1136/adc.68.6.743
- Gross RE. The Surgery of Infancy and Childhood: Its Principles and Techniques. Philadelphia: W.B. Saunders; 1953.
- Legrand C, Michaud L, Salleron J, et al. Long-term outcome of children with oesophageal atresia type III. Arch Dis Child 2012; 97: 808-811. https://doi.org/10.1136/archdischild-2012-301730
- Rintala RJ, Pakarinen MP. Long-term outcome of esophageal anastomosis. Eur J Pediatr Surg 2013; 23: 219-225. https://doi.org/10.1055/s-0033-1347912
- Castilloux J, Noble AJ, Faure C. Risk factors for short- and long-term morbidity in children with esophageal atresia. J Pediatr 2010; 156: 755-760. https://doi.org/10.1016/j.jpeds.2009.11.038
- Krishnan U, Mousa H, Dall’Oglio L, et al. ESPGHAN-NASPGHAN guidelines for the evaluation and treatment of gastrointestinal and nutritional complications in children with esophageal atresia-tracheoesophageal fistula. J Pediatr Gastroenterol Nutr 2016; 63: 550-570. https://doi.org/10.1097/MPG.0000000000001401
- Pedersen RN, Markøw S, Kruse-Andersen S, et al. Esophageal atresia: gastroesophageal functional follow-up in 5-15 year old children. J Pediatr Surg 2013; 48: 2487-2495. https://doi.org/10.1016/j.jpedsurg.2013.07.019
- Chittmittrapap S, Spitz L, Kiely EM, Brereton RJ. Anastomotic stricture following repair of esophageal atresia. J Pediatr Surg 1990; 25: 508-511. https://doi.org/10.1016/0022-3468(90)90561-m
- Koivusalo A, Turunen P, Rintala RJ, van der Zee DC, Lindahl H, Bax NMA. Is routine dilatation after repair of esophageal atresia with distal fistula better than dilatation when symptoms arise? Comparison of results of two European pediatric surgical centers. J Pediatr Surg 2004; 39: 1643-1647. https://doi.org/10.1016/j.jpedsurg.2004.07.011
- Michaud L, Guimber D, Sfeir R, et al. Anastomotic stenosis after surgical treatment of esophageal atresia: frequency, risk factors and effectiveness of esophageal dilatations. Arch Pediatr 2001; 8: 268-274. https://doi.org/10.1016/s0929-693x(00)00193-7
- Lindahl H, Rintala R. Long-term complications in cases of isolated esophageal atresia treated with esophageal anastomosis. J Pediatr Surg 1995; 30: 1222-1223. https://doi.org/10.1016/0022-3468(95)90028-4
- Taylor ACF, Breen KJ, Auldist A, et al. Gastroesophageal reflux and related pathology in adults who were born with esophageal atresia: a long-term follow-up study. Clin Gastroenterol Hepatol 2007; 5: 702-706. https://doi.org/10.1016/j.cgh.2007.03.012
- Koivusalo A, Pakarinen MP, Rintala RJ. The cumulative incidence of significant gastrooesophageal reflux in patients with oesophageal atresia with a distal fistula--a systematic clinical, pH-metric, and endoscopic follow-up study. J Pediatr Surg 2007; 42: 370-374. https://doi.org/10.1016/j.jpedsurg.2006.10.010
- Puntis JW, Ritson DG, Holden CE, Buick RG. Growth and feeding problems after repair of oesophageal atresia. Arch Dis Child 1990; 65: 84-88. https://doi.org/10.1136/adc.65.1.84
- König TT, Stefanescu MC, Wildermuth M, Frankenbach LM, Muensterer OJ, Gianicolo E. Sex-specific percentiles for bodyweight and height in children born with esophageal atresia: a registry-based analysis 2001-2021. BMC Pediatr 2023; 23: 27. https://doi.org/10.1186/s12887-023-03842-4
- Deurloo JA, Ekkelkamp S, Schoorl M, Heij HA, Aronson DC. Esophageal atresia: historical evolution of management and results in 371 patients. Ann Thorac Surg 2002; 73: 267-272. https://doi.org/10.1016/s0003-4975(01)03263-5
- Penikis AB, Sescleifer AM, Kunisaki SM. Management of long-gap esophageal atresia. Transl Pediatr 2024; 13: 329-342. https://doi.org/10.21037/tp-23-453
- Stadil T, Koivusalo A, Svensson JF, et al. Surgical treatment and major complications Within the first year of life in newborns with long-gap esophageal atresia gross type A and B - a systematic review. J Pediatr Surg 2019; 54: 2242-2249. https://doi.org/10.1016/j.jpedsurg.2019.06.017
- Coppens CH, van den Engel-Hoek L, Scharbatke H, de Groot SAF, Draaisma JMT. Dysphagia in children with repaired oesophageal atresia. Eur J Pediatr 2016; 175: 1209-1217. https://doi.org/10.1007/s00431-016-2760-4
- Sociedad Española de Gastroenterología, Hepatología y Nutrición Pediátrica. Nutritional calculator. Available at: https://www.seghnp.org/nutricional/ (Accessed on Nov 10, 2022).
- Carrascosa A. Secular growth acceleration in Spain. Spanish growth studies 2010. Spanish-born population and immigrant population. Endocrinol Nutr 2014; 61: 229-233. https://doi.org/10.1016/j.endonu.2014.03.004
- Depoortere S, Lapillonne A, Sfeir R, et al. Nutritional status at age 1 year in patients born with esophageal atresia: a population-based, prospective cohort study. Front Pediatr 2022; 10: 969617. https://doi.org/10.3389/fped.2022.969617
- Maan M, Kaur S, Kalyan G, et al. Growth and development assessment of children (1-5 years) operated for tracheoesophageal fistula/esophageal atresia: a case control study. J Indian Assoc Pediatr Surg 2021; 26: 216-222. https://doi.org/10.4103/jiaps.JIAPS_35_20
- IJsselstijn H, Gischler SJ, Toussaint L, Spoel M, Zijp MHMVDCV, Tibboel D. Growth and development after oesophageal atresia surgery: need for long-term multidisciplinary follow-up. Paediatr Respir Rev 2016; 19: 34-38. https://doi.org/10.1016/j.prrv.2015.07.003
- Chetcuti P, Phelan PD. Gastrointestinal morbidity and growth after repair of oesophageal atresia and tracheo-oesophageal fistula. Arch Dis Child 1993; 68: 163-166. https://doi.org/10.1136/adc.68.2.163
Copyright and license
Copyright © 2026 The Author(s). This is an open access article distributed under the Creative Commons Attribution License (CC BY), which permits unrestricted use, distribution, and reproduction in any medium or format, provided the original work is properly cited.